Contributors shows everyone who wrote in a shared document, how many changes each person made, and when they made them. It is most useful for group work. If only one person wrote in the document, the section has a single row.
This section appears only in Google Docs reports. If the document has more than one tab, the section covers only the tab the report is for, and its subtitle reads Everyone who wrote in this document tab.
A. Summary table
The summary table is what you see first. It has one row for each contributor.
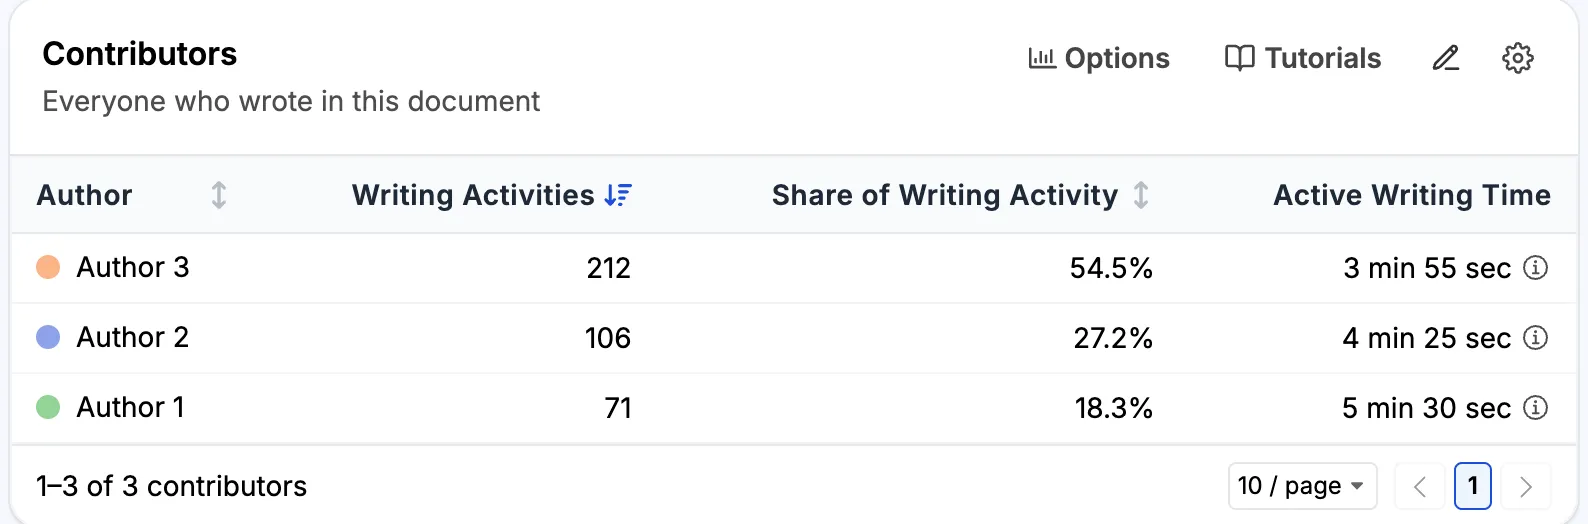
- Author is the person’s name in Google Docs. The colored dot is the color used for that person in the chart.
- Writing Activities is the number of changes the person made. The table is sorted by this column, from most to least.
- Share of Writing Activity is the person’s writing activities as a percentage of all writing activities. Here, Author 3 made 212 of the 389 changes, which is 54.5%.
- Active Writing Time is the time the person spent typing. It is counted the same way as Active Writing Time for the whole document, using only this person’s changes. A person who made a single change shows ~0 sec. Click a time for a short explanation.
You can sort the table by Author, Writing Activities, or Share of Writing Activity. The footer shows the number of contributors, and you can choose how many rows to show per page.
1. What a writing activity is
A writing activity is one change recorded by Google Docs. Google records changes almost character by character. So one writing activity can be a single typed letter, a deletion, a whole pasted paragraph, or a formatting change such as bold.
Changes that Google saved at the same moment count as one writing activity. For example, edits made offline are often uploaded together when the device reconnects, so they count as one. Restoring an earlier version from the version history is not counted for anyone.
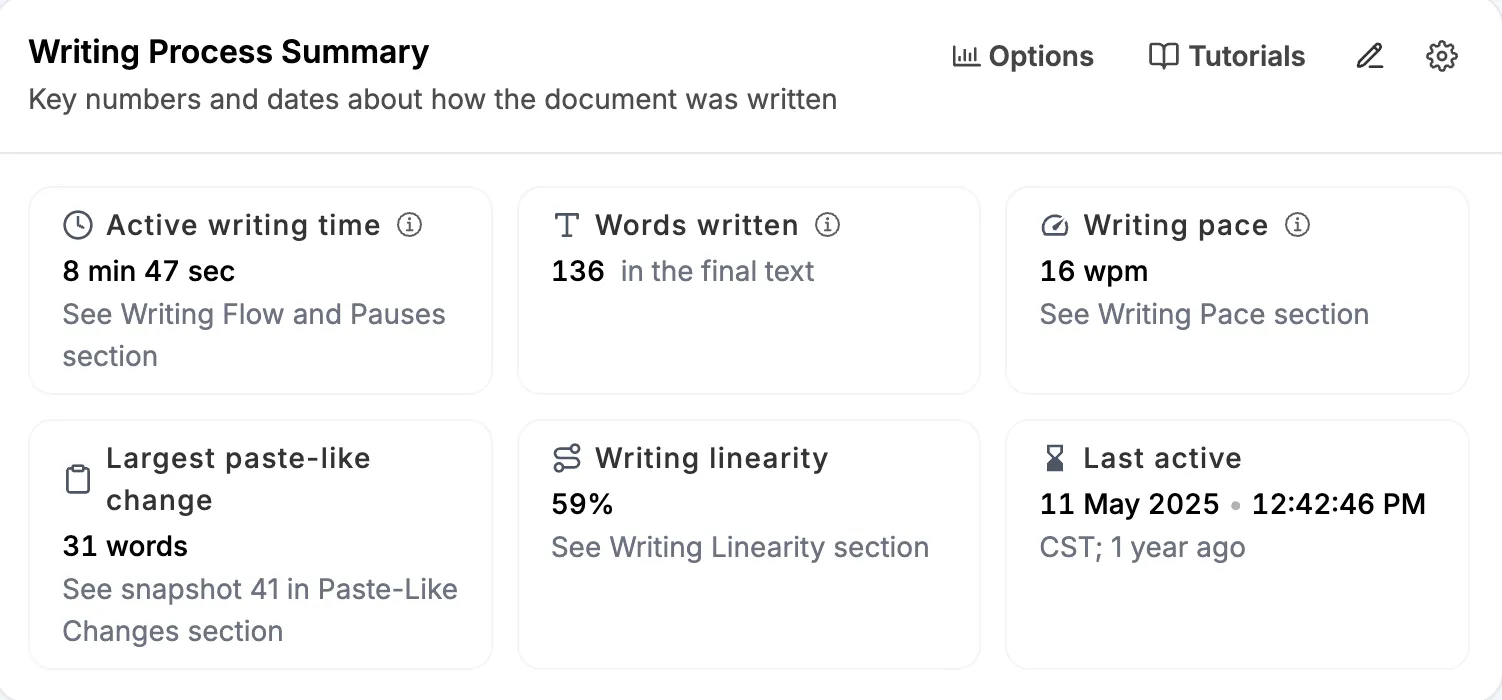
In most reports, the writing activities of all contributors add up to Available changes in the Writing Process Summary. Here, 212 + 106 + 71 = 389.
A writing activity is not a character or a word. Someone who types a paragraph makes many writing activities. Someone who pastes the same paragraph makes one. Someone who fixes formatting for ten minutes can make more than someone who writes a careful paragraph in one go.
2. Read the last two columns together
In the example, Author 3 has the largest share, 54.5%, but the least active writing time, 3 min 55 sec. Author 1 has the smallest share, 18.3%, but the most time, 5 min 30 sec. The two columns rank the authors in opposite order.
The table cannot tell you why. Author 3 may have typed quickly in one long stretch. Author 1 may have stopped often to think, or come back several times for short visits. To find out, look at the chart, or watch the document being written in Writing Replay.
3. The times can add up to more than the document total
In the example, the three times add up to 13 min 50 sec. The active writing time for the whole document is 8 min 47 sec. There are two reasons:
- A stretch of typing shorter than one minute counts as one minute. This rounding is done for each person separately, so the same few minutes can be rounded up more than once.
- When two people type at the same time, that time counts for both of them.
B. Chart view
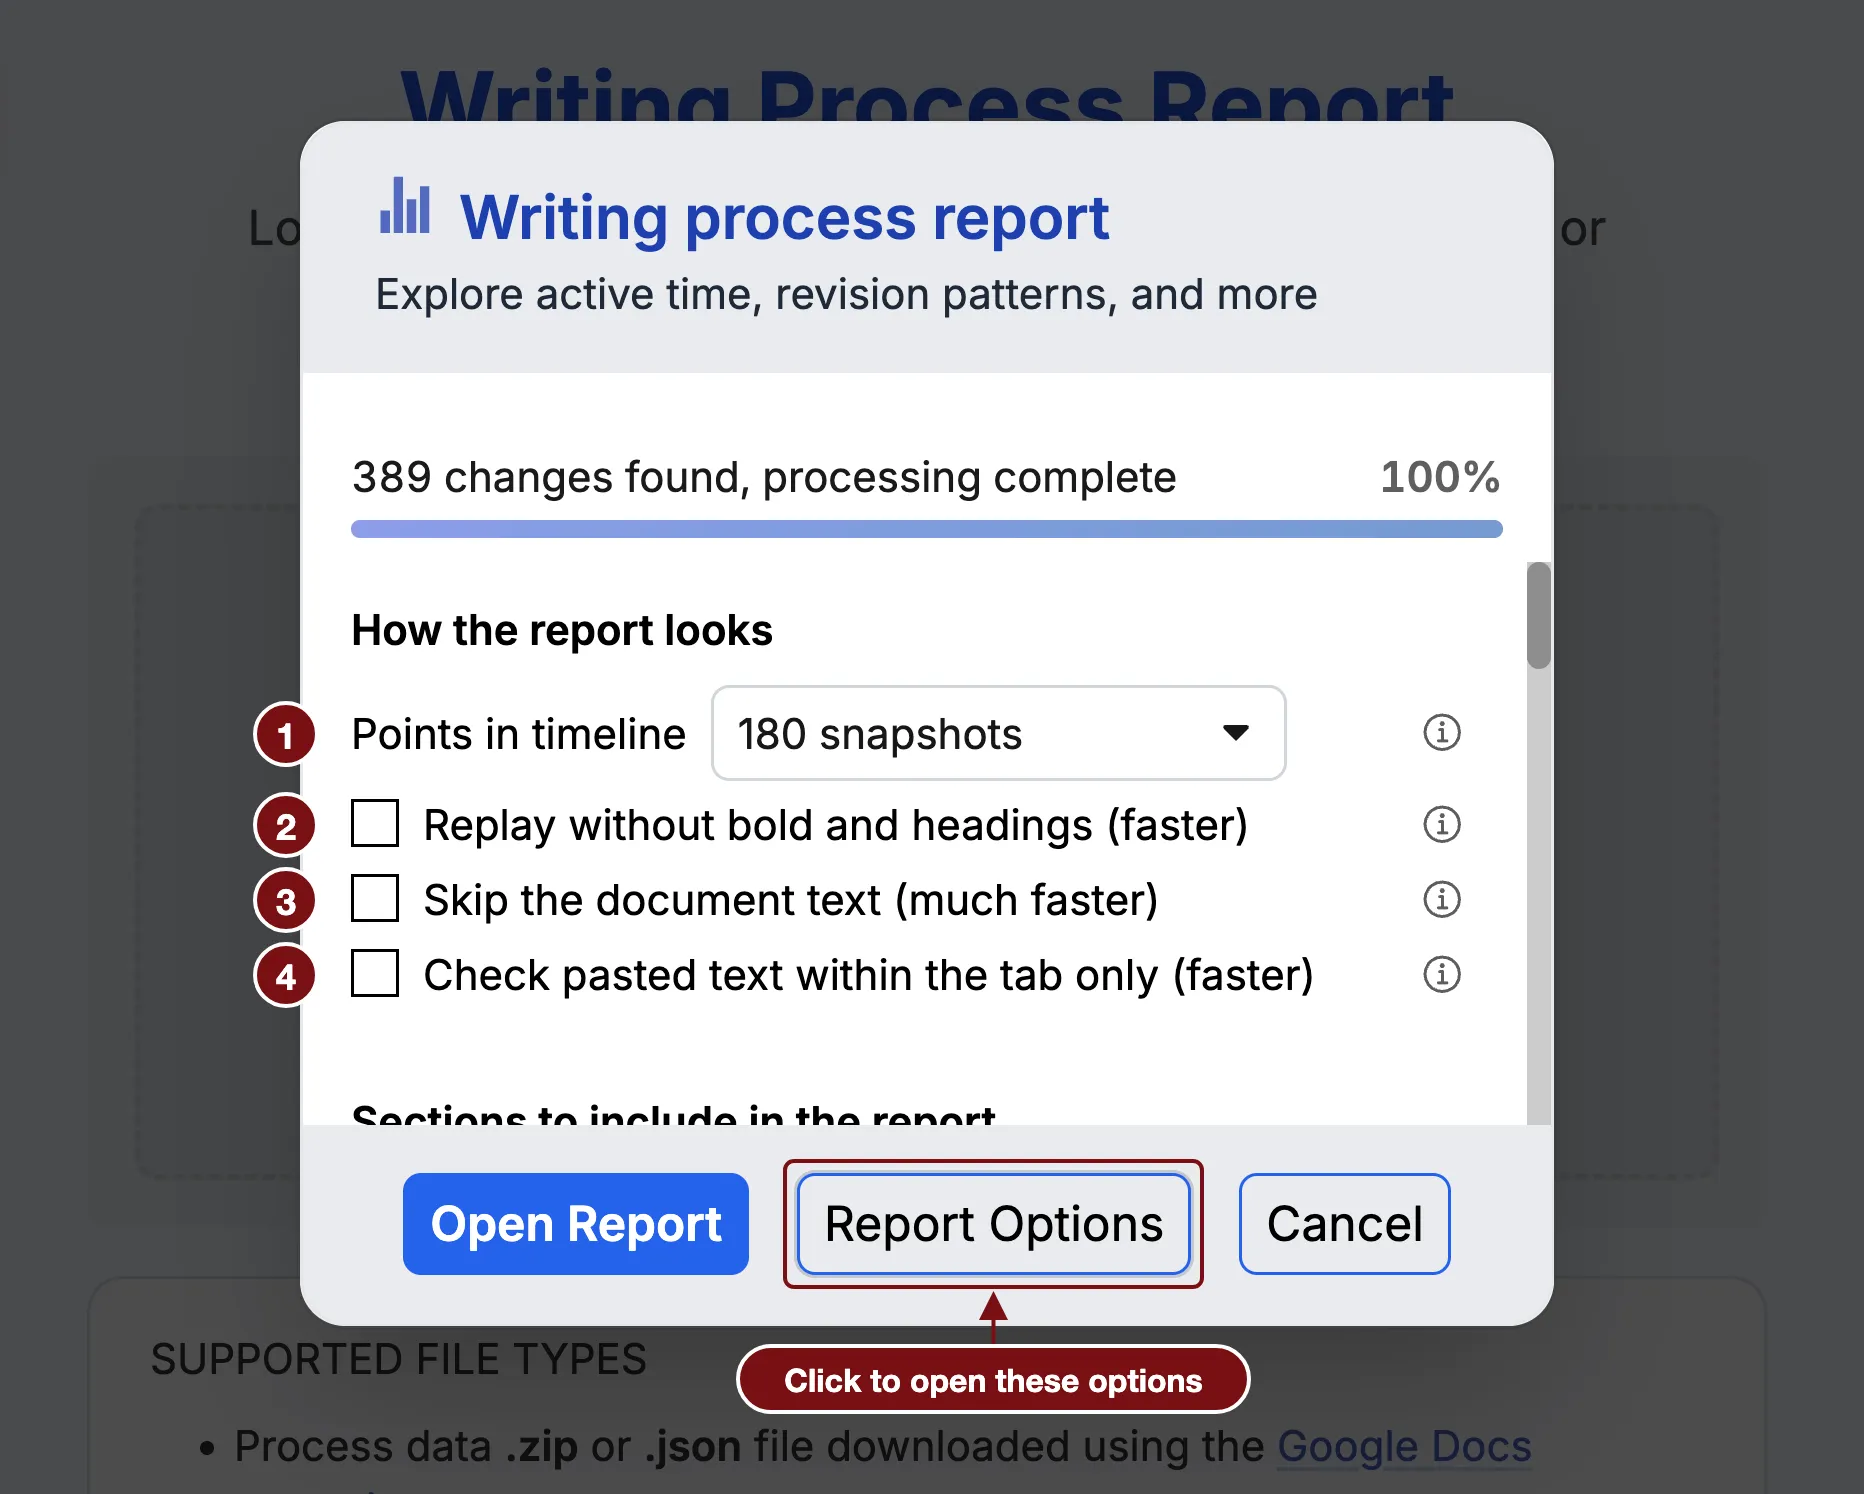
To see the chart, open Options and choose Chart under Show data as.
1. Each bar is one snapshot
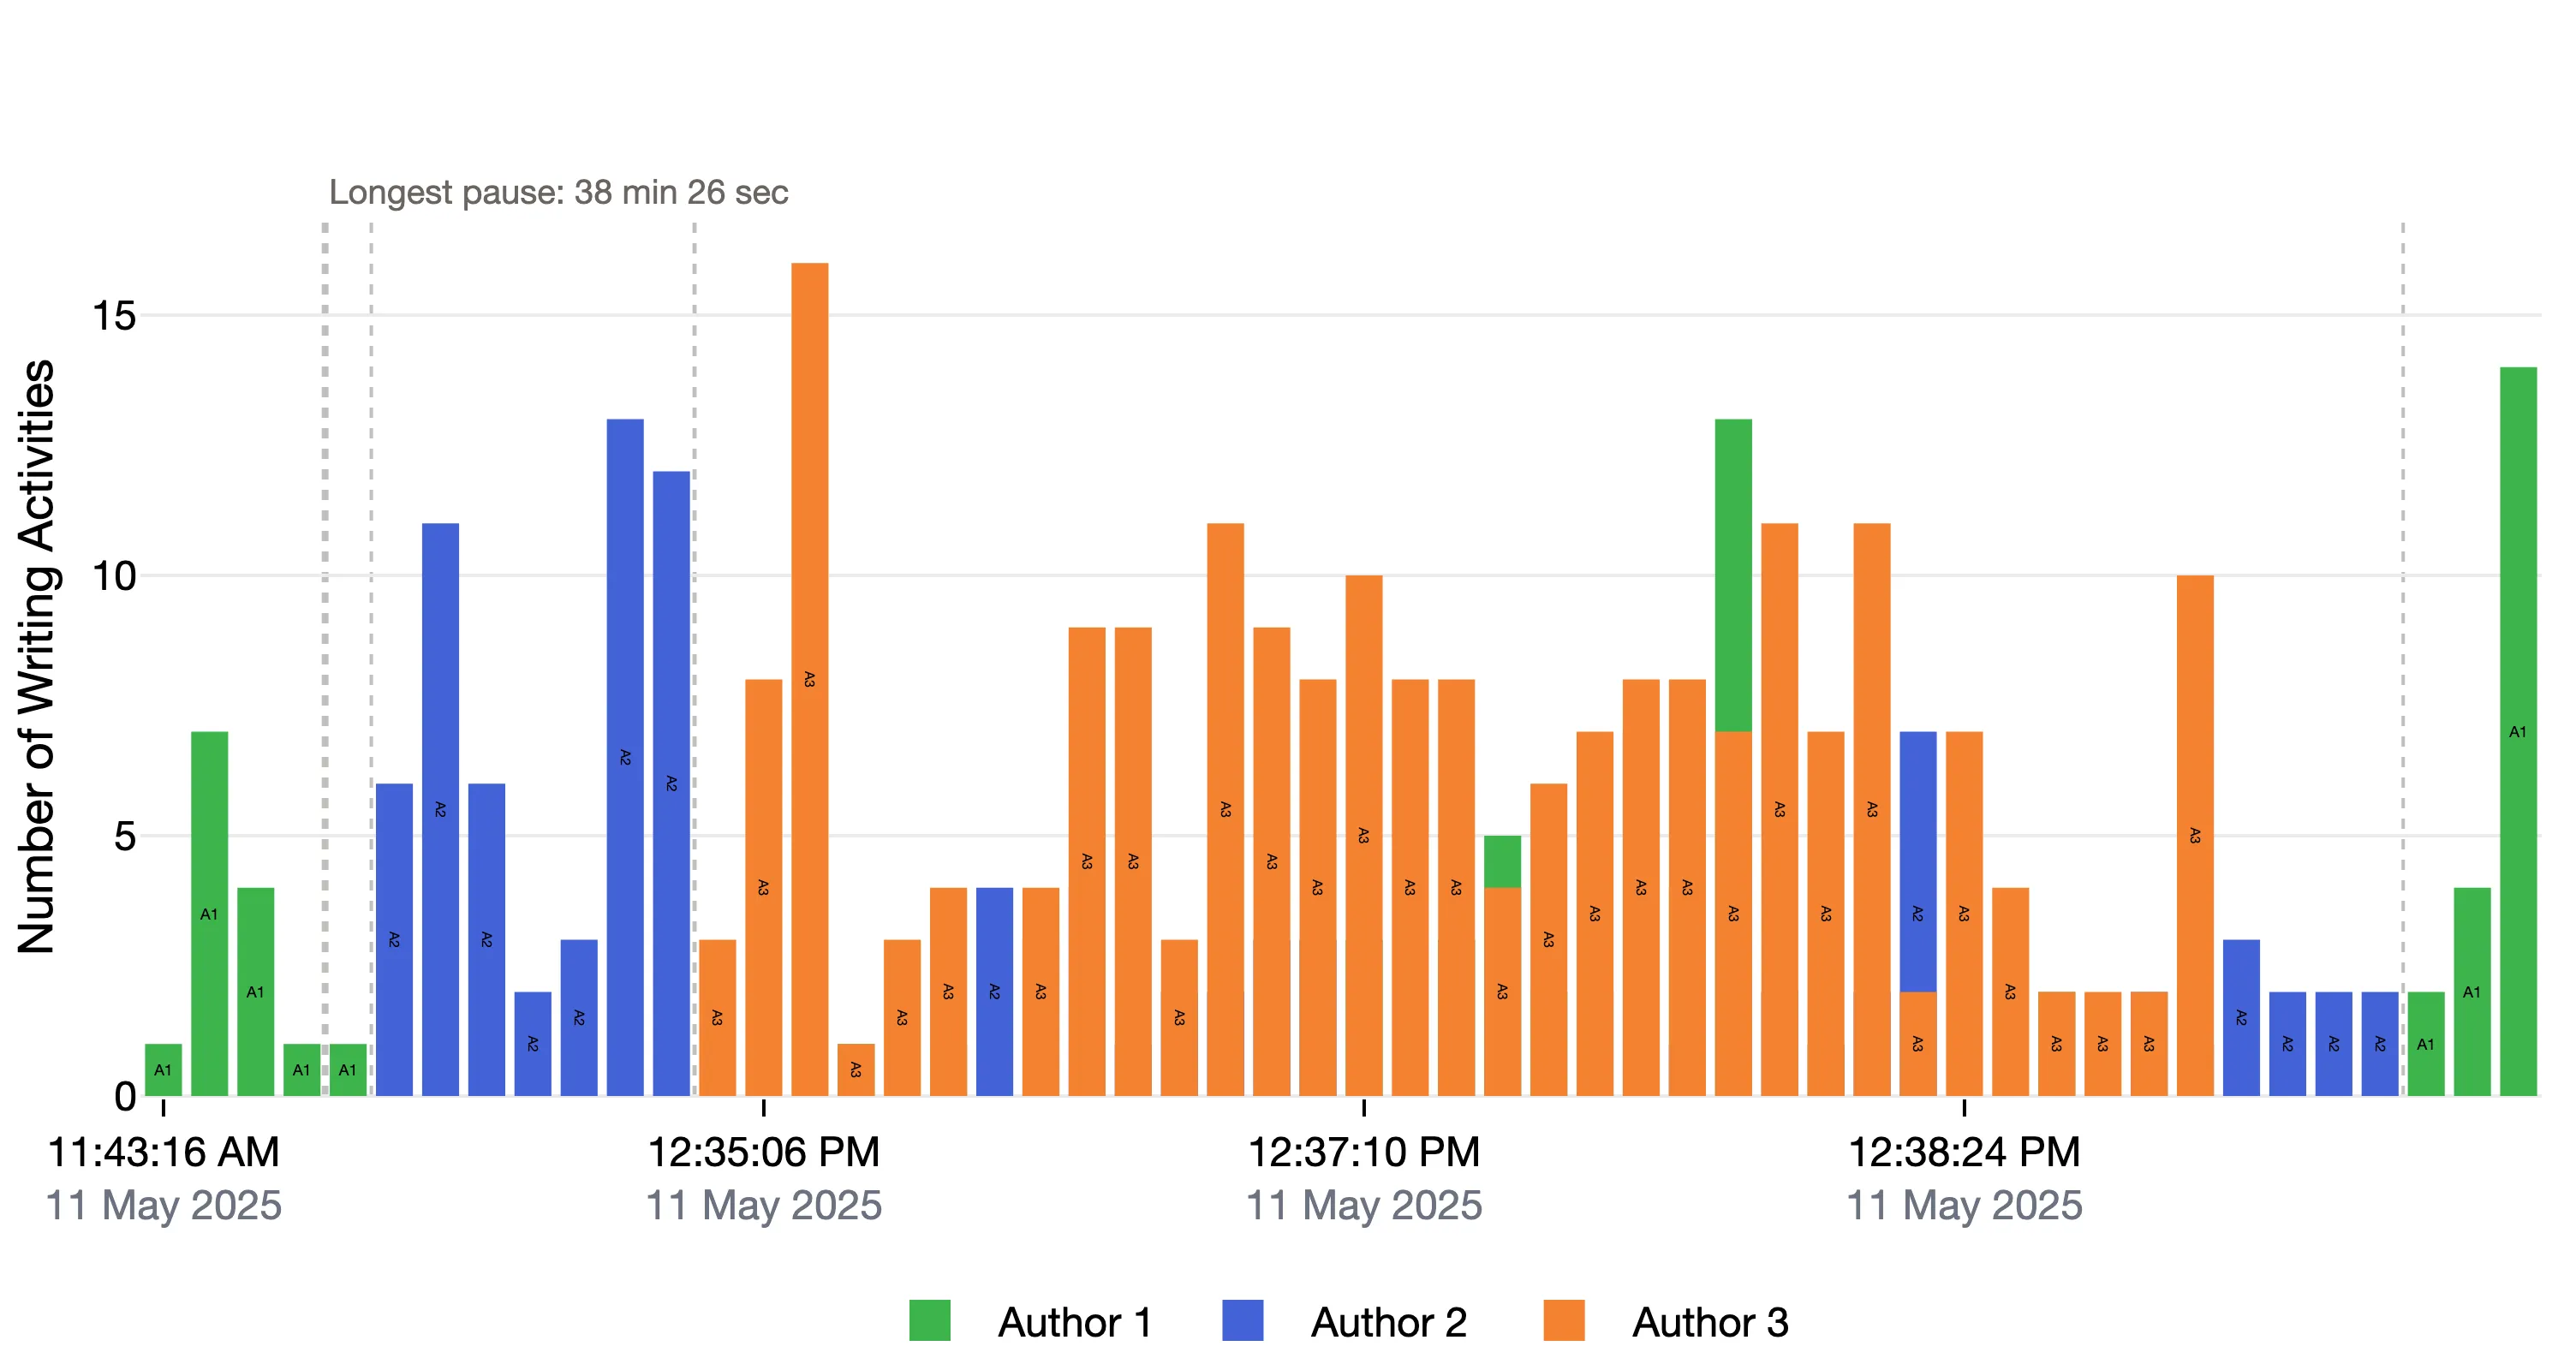
Time runs from left to right, and each bar is one snapshot. The height of a bar is the number of writing activities since the previous snapshot. The color tells you who made them, and the legend under the chart names each color. The short label inside a bar, such as A1, is the author’s initials, so you do not need to rely on color.
By default, the bars are placed one after another, so a long pause takes up no space. The labels under the chart give the time and date. To space the bars by clock time instead, see Options.
2. Bars from two authors overlap
When two people wrote in the same snapshot, their bars are drawn in the same place, one in front of the other. Both bars start from zero. They are not stacked.
In the example, one bar between 12:37:10 PM and 12:38:24 PM is green up to 13, with an orange bar up to 7 in front of it. Author 1 made 13 writing activities in that snapshot, and Author 3 made 7.
If the bar in front is taller, it hides the bar behind it. To see every author at every snapshot, use the Detailed table.
3. Dashed lines are the longest pauses
A dashed line marks a typing pause longer than one minute. The longest pause is labeled with its length. Here, it is 38 min 26 sec, near the start. As in Writing Flow and Pauses, the pauses are not drawn to scale. One minute is the default, and you can change it in Settings, under AFK time for considering inactive.
4. Patterns to look for
- Colors mixed together suggest that people wrote at the same time, or took short turns.
- Long runs of one color suggest that people took turns, each writing their own part.
- One color for most of the chart means one person made most of the changes. Before you conclude anything, remember what a writing activity is.
In the example, the group mostly took turns. Author 1 started. After the long pause, Author 2 wrote for a while. Author 3 then wrote most of the middle, with a few changes from Author 1 and Author 2 along the way. Author 2 and then Author 1 made the last changes.
5. Click a bar to see what changed
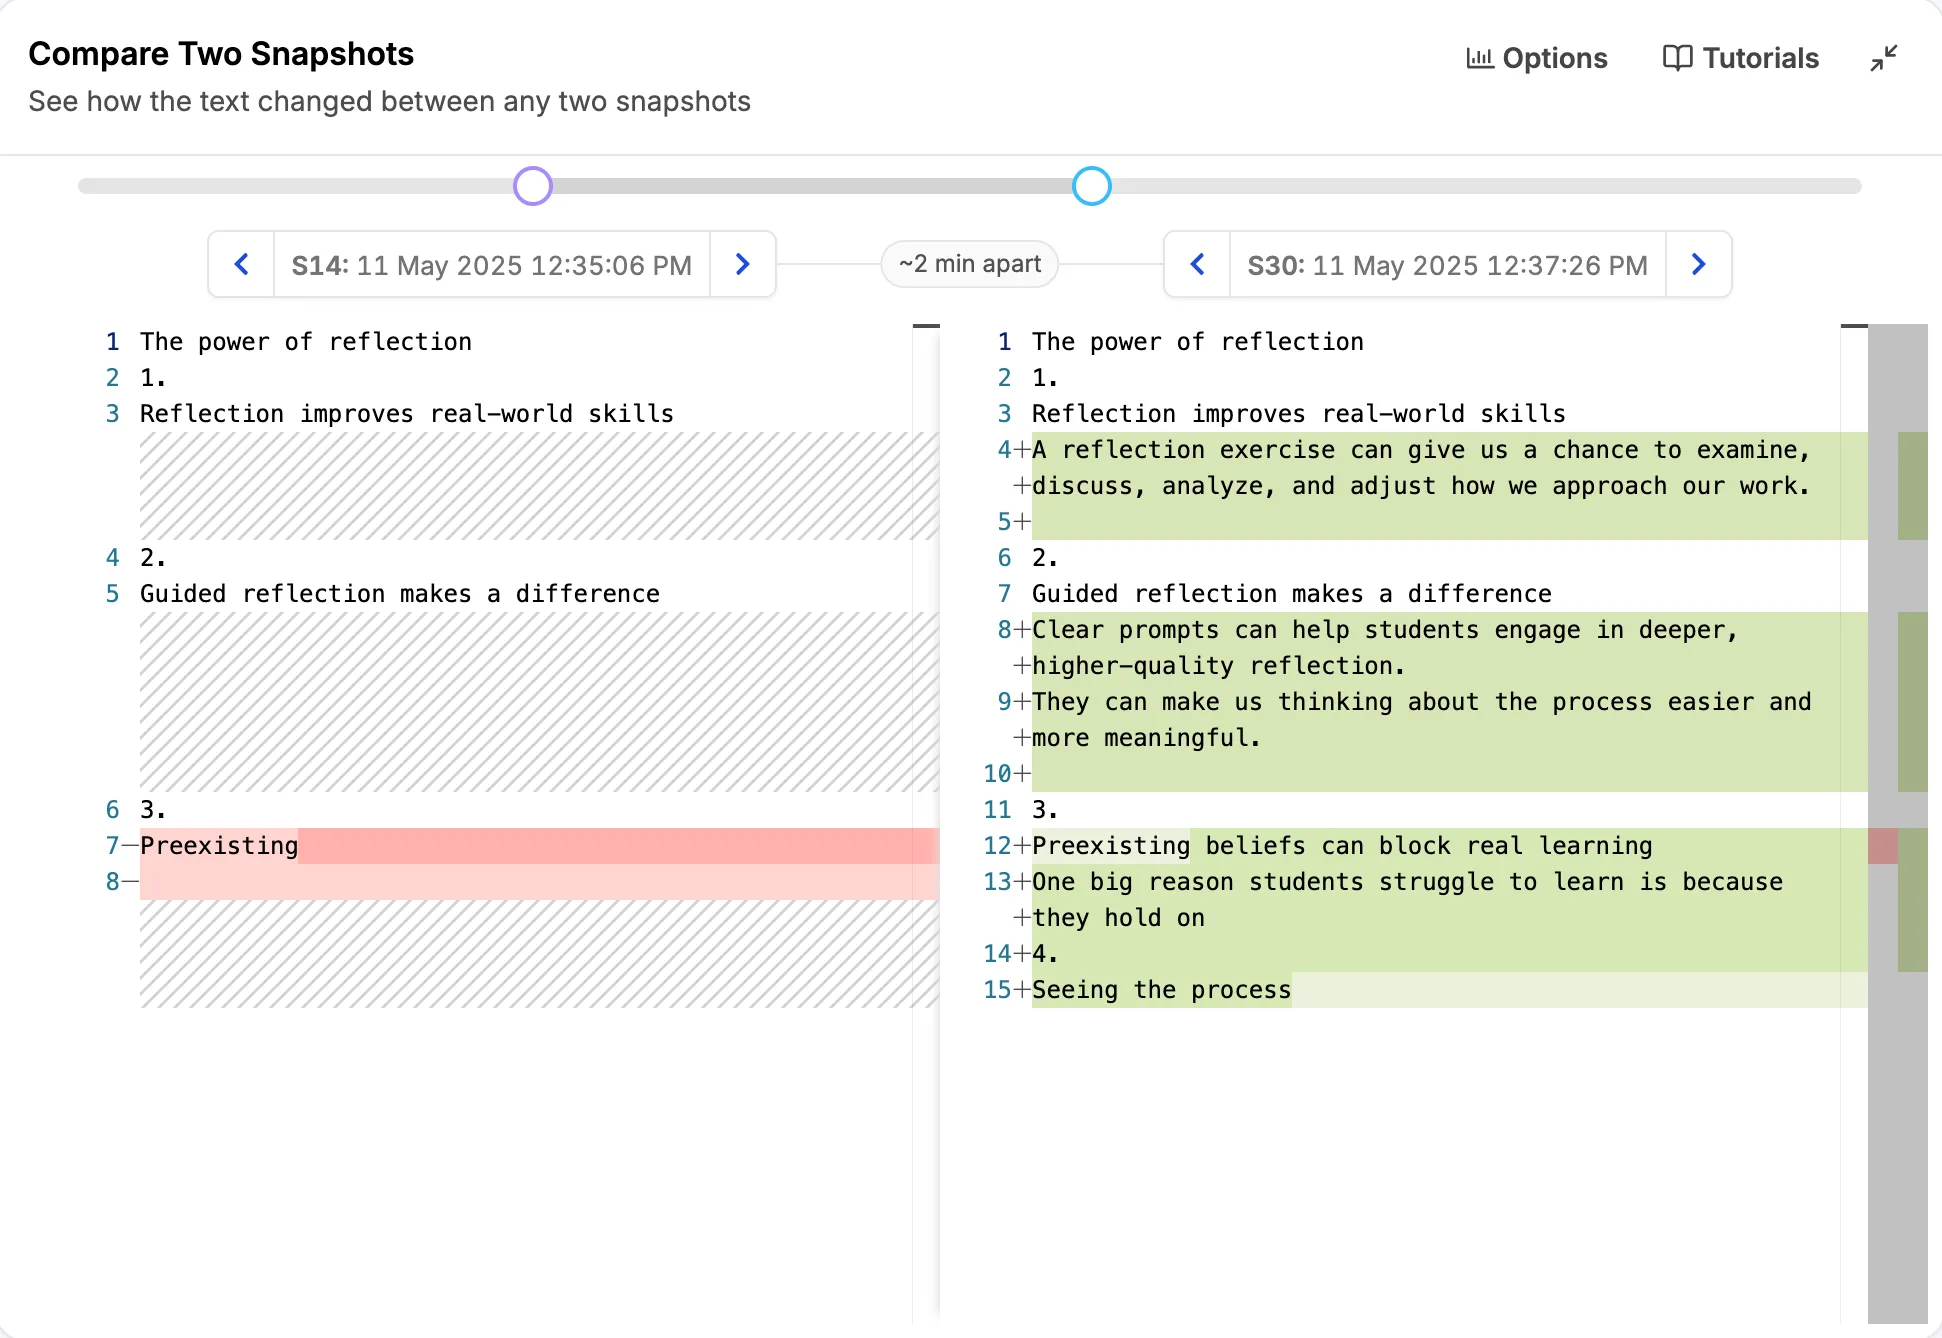
Click a bar to jump to the Compare Two Snapshots section of the report. It opens with that snapshot and the one before it, so you can read the text that was added or removed. If Compare Two Snapshots is not in the report, a message tells you to include it in Report Options.
Hover over a bar to see the author, the number of writing activities, and the snapshot number and time.
The buttons above the top right of the chart let you download the chart as an image, zoom in and out, reset the view, and show the chart on the whole screen.
C. Detailed table
To see the detailed table, open Options and choose Detailed table under Show data as. It has one row for each author in each snapshot, in time order. It holds the same numbers as the chart, so you can read the chart without relying on color, or find a bar that is hidden behind another.
- Snapshot is the snapshot number.
- Time is when the snapshot was taken. Click it to jump to Compare Two Snapshots, the same as clicking a bar in the chart.
- Author and Writing Activities are the same as in the summary table, for that snapshot only.
Every column can be sorted.
D. Options
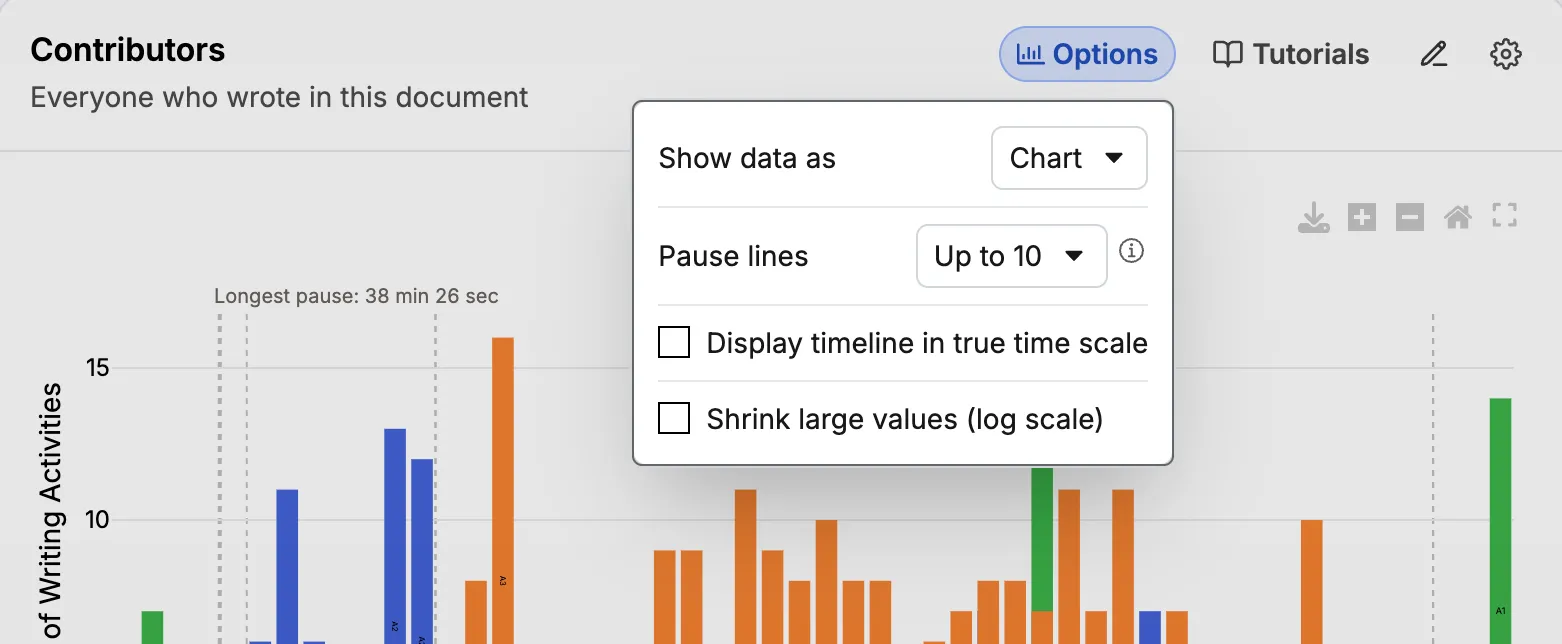
- Show data as switches between Summary table, Chart, and Detailed table. Summary table is the default. Your choice is saved in your browser and used for later reports.
- Pause lines sets how many dashed pause lines the chart draws: none, up to 10, up to 50, or up to 100. The default is up to 10. The longest pauses are drawn first. Hover over the ⓘ icon for a short explanation.
- Display timeline in true time scale spaces the bars by clock time, so long pauses take up space. Pause lines are not drawn in this mode.
- Shrink large values (log scale) compresses the vertical axis. This helps when a few tall bars make the others too short to read. With it on, bar heights rank the bars but no longer measure them.
The last three options apply only to the chart. They are grayed out when a table is shown.
E. Who is listed
- Everyone who made at least one change in the document, or in the tab, is listed by the name Google Docs gives them in the version history.
- Anonymous contributors. If Google Docs does not give a name for someone who made changes, the person is listed as Anonymous 1, Anonymous 2, and so on. This happens, for example, when someone edited without signing in. Click the name for a short explanation.
- People with the same name are listed with a number after the name, such as Alex (1) and Alex (2).
- The list can be incomplete. Sometimes Process Feedback cannot get full author information from Google. A note under the section reminds you of this. Opening the report again can sometimes help.
F. What it does not tell you
Writing activities are not contribution. They count changes, not characters, words, or ideas.
It cannot see work done outside the document. Finding sources, planning, running meetings, and drafting in another file do not appear.
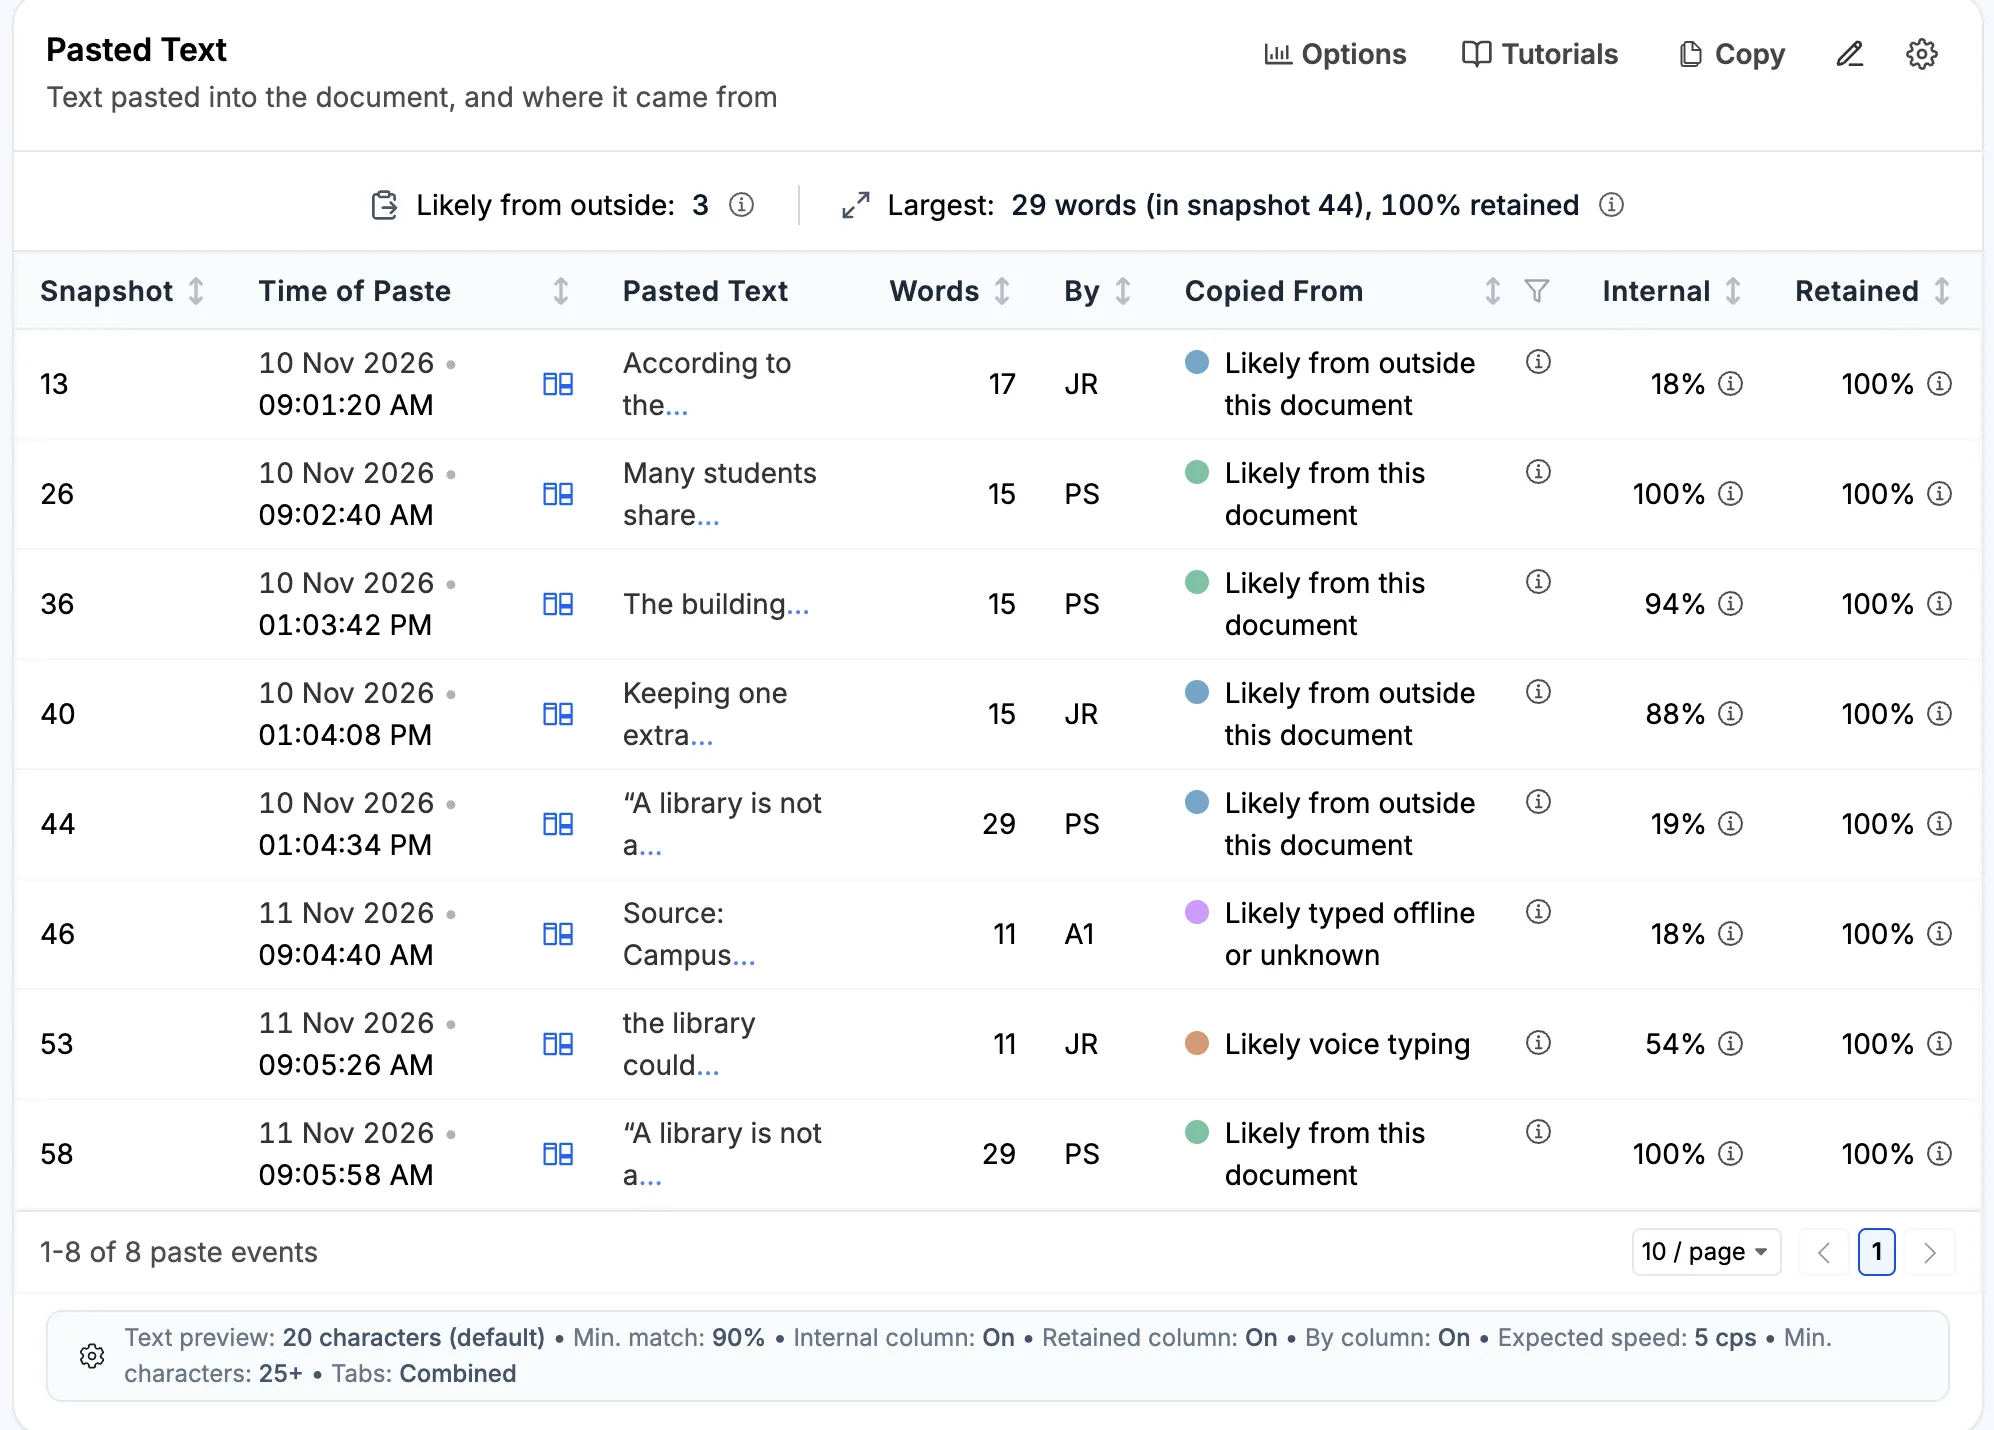
Credit goes to the account that made the change. Text pasted in for someone else is credited to the person who pasted it. If a group shares one account, or one person types while the others talk, the report shows who typed, not who came up with the words.
To see who pasted what, turn on Show “By” (who pasted) column in Copy-Paste Activity.