Tutorials and Help
How to read the numbers, charts, and tables in process reports and dashboards
No help pages match your search.
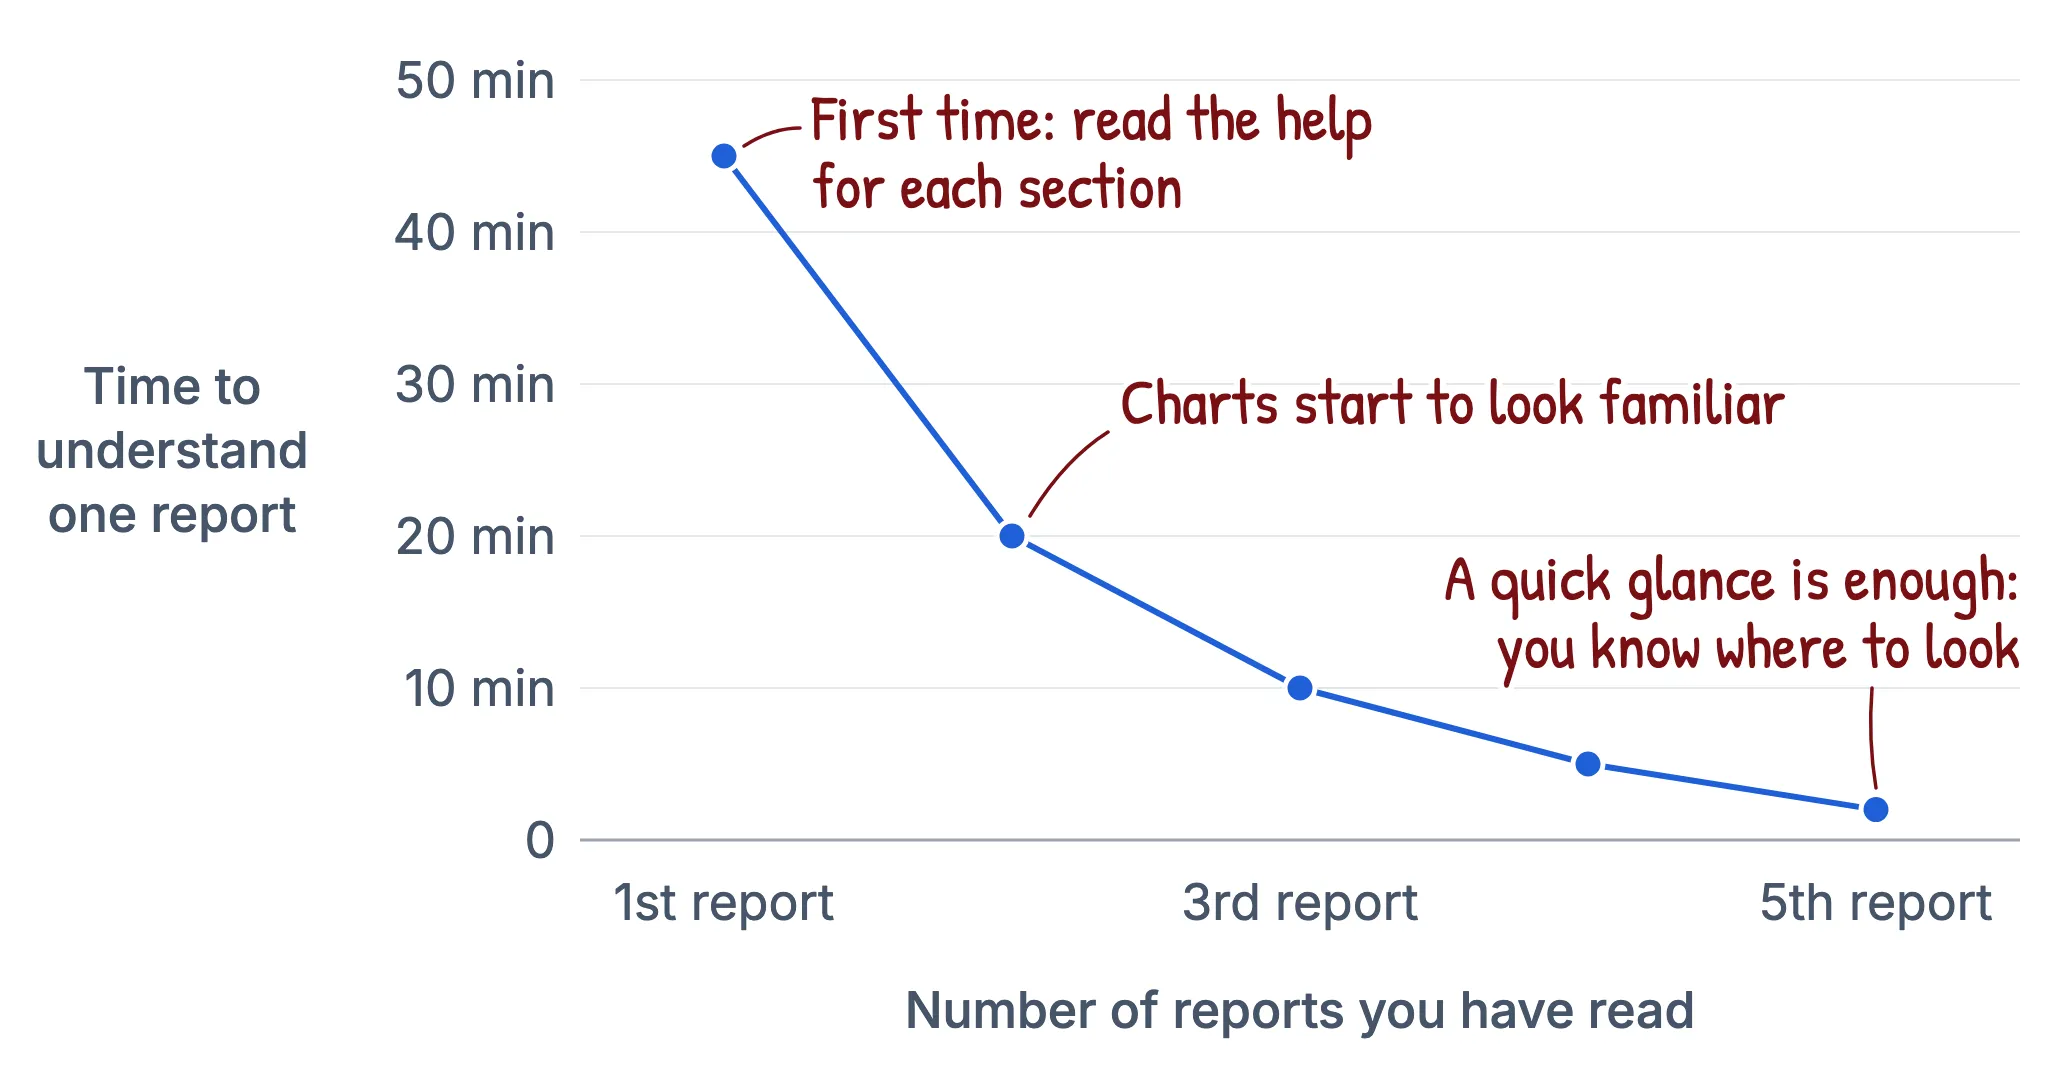
Why read our help pages?
Help pages can help you become expert at observing common patterns in the reports
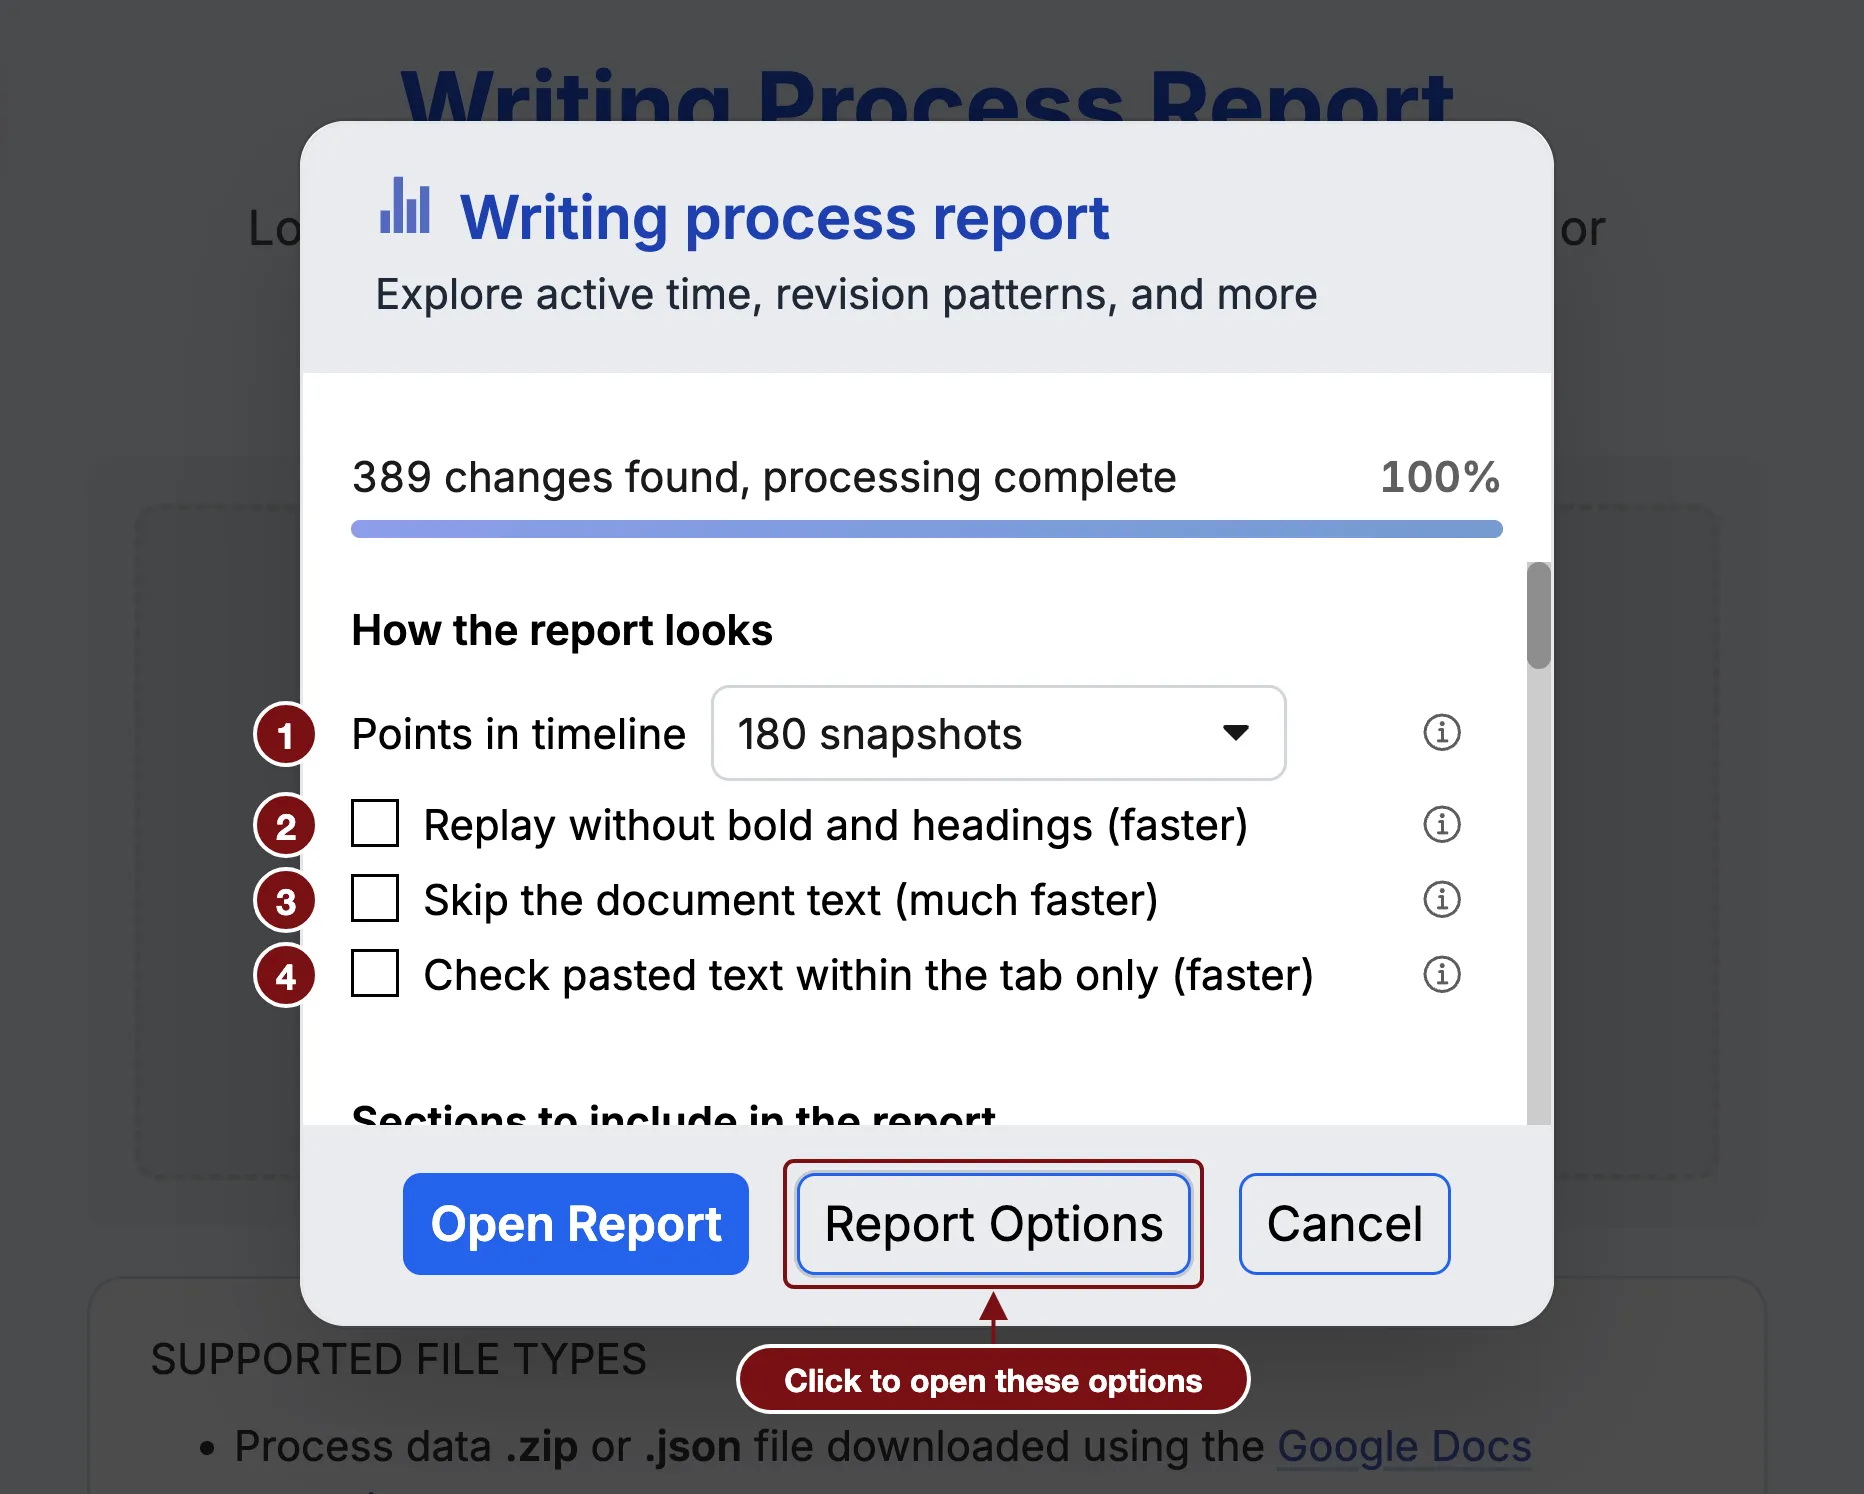
Report Options and tips for large reports
Change how the report looks and how to open large reports faster
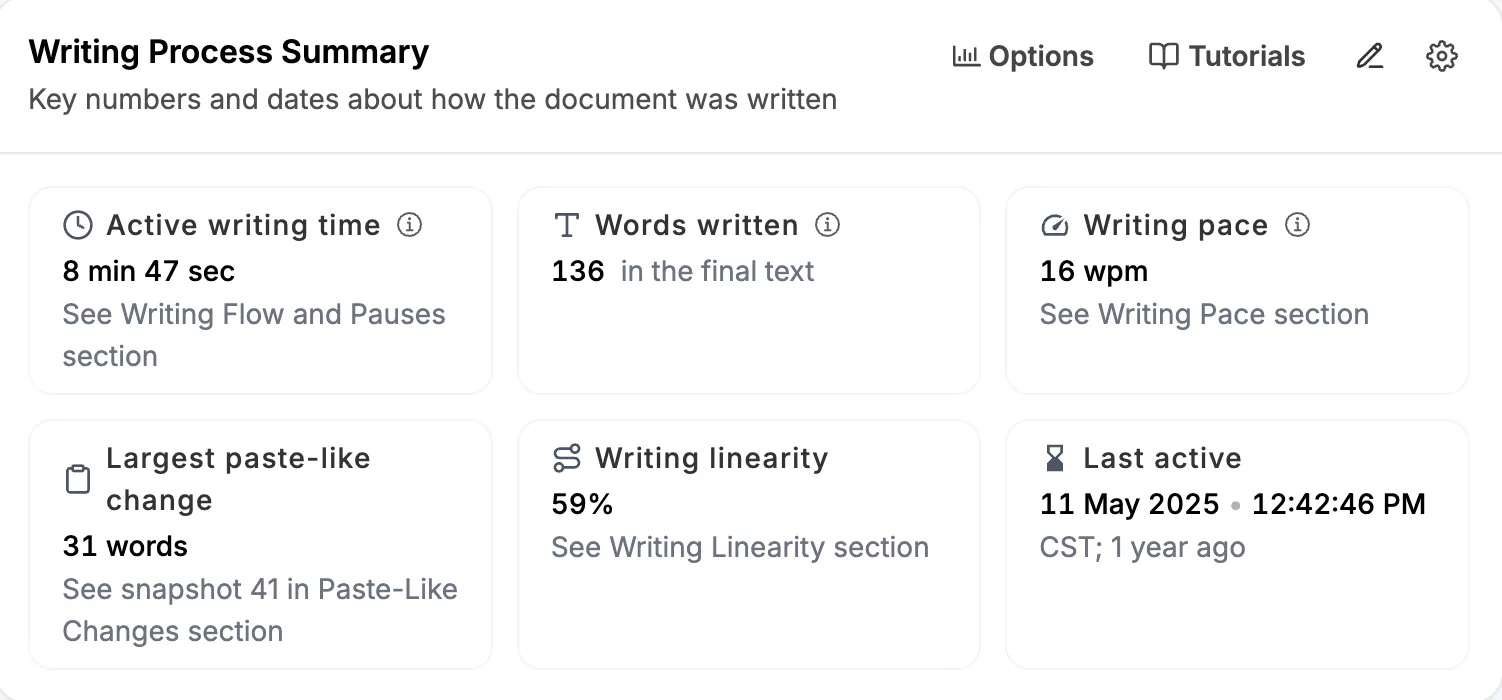
Writing Process Summary
Key numbers and dates about how the document was written, and what each one means
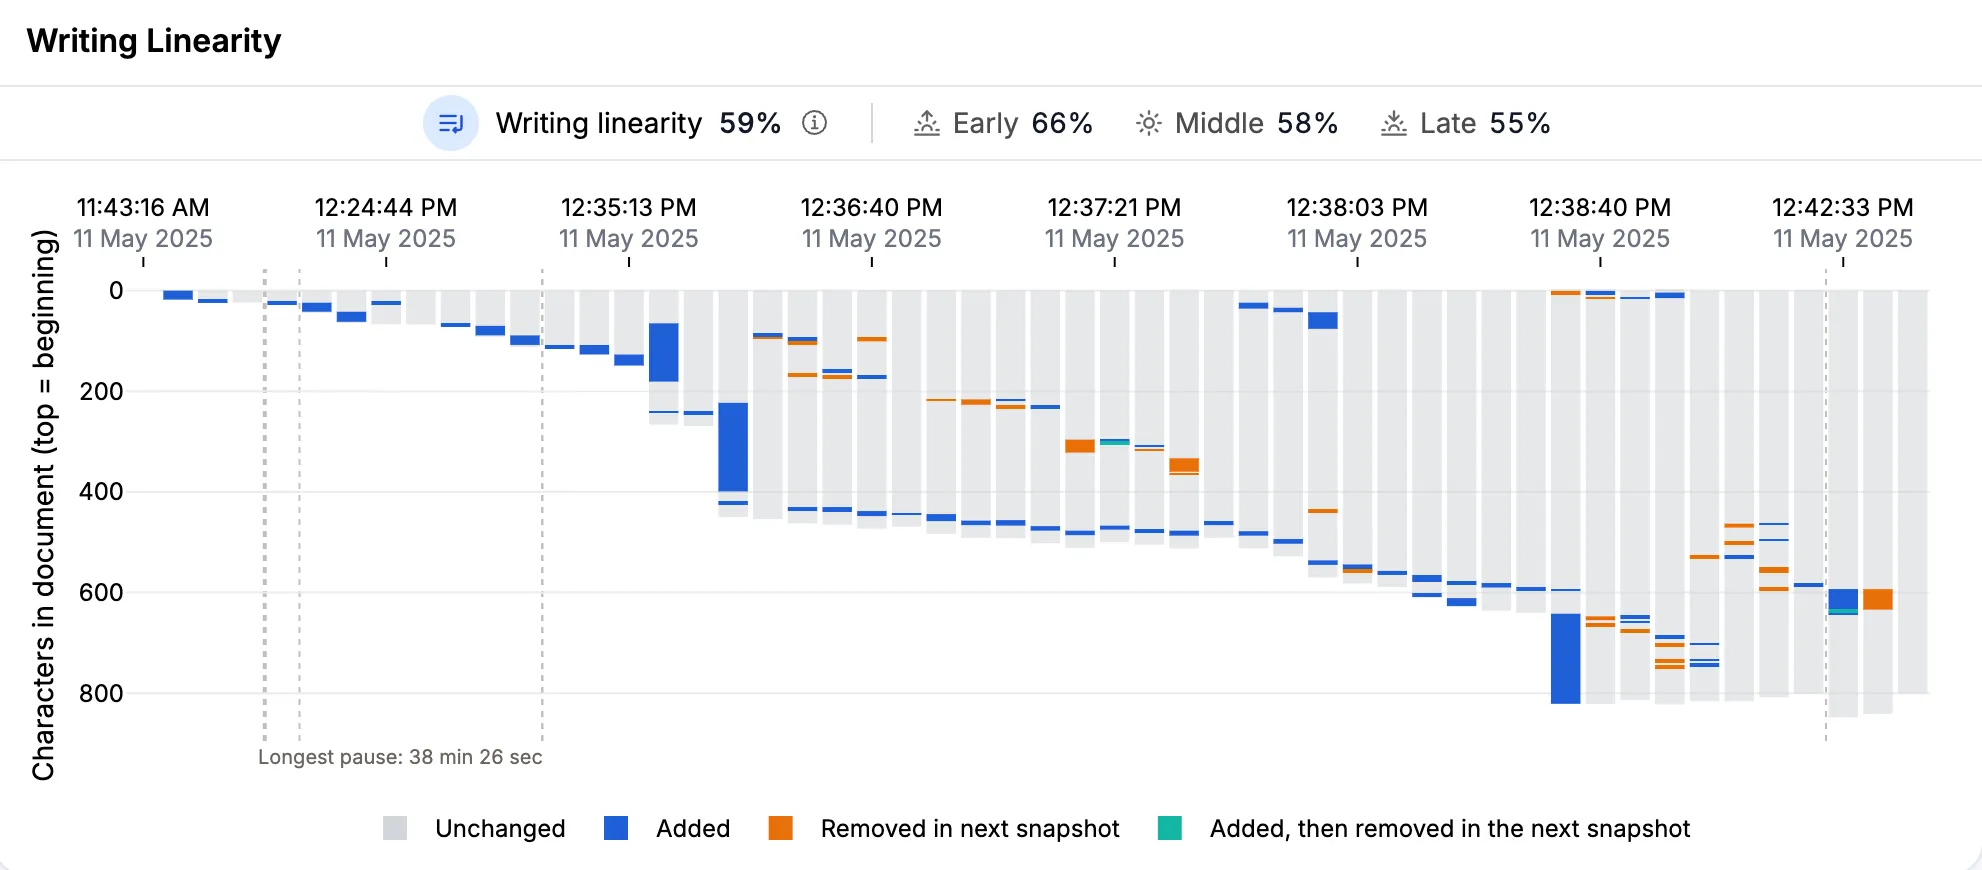
Writing Linearity
Whether text was written in order, and where and when it changed
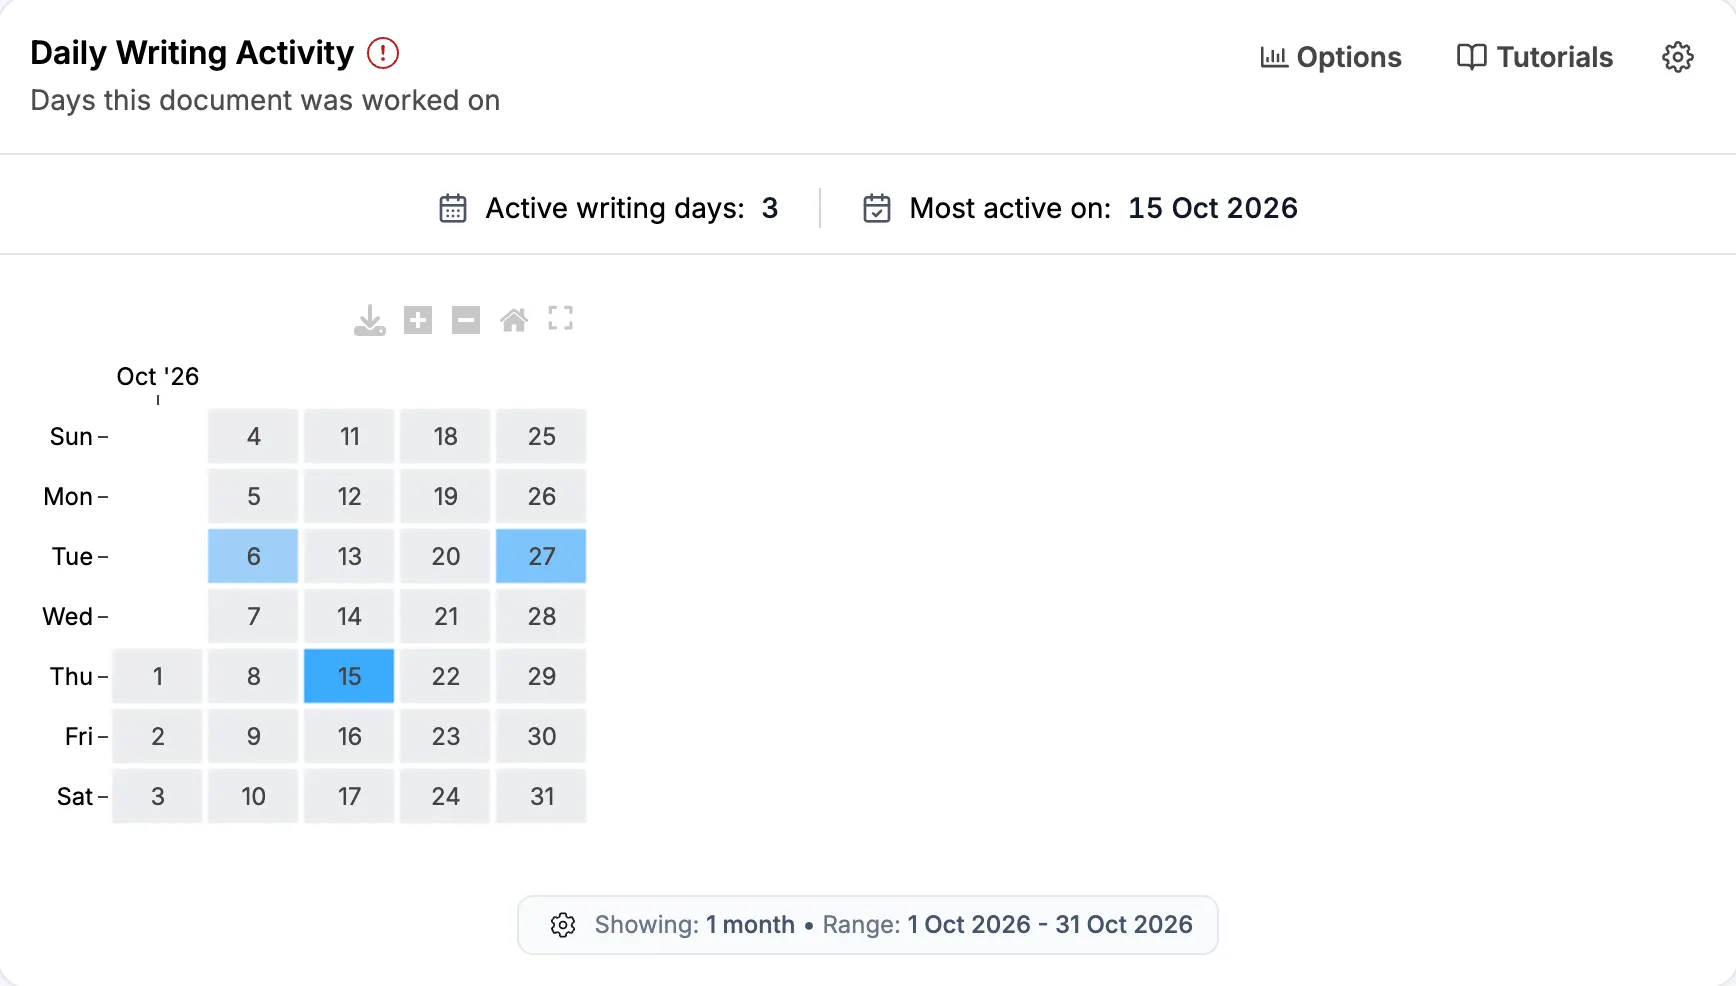
Daily Writing Activity
The days the document was worked on, and how much writing happened on each day
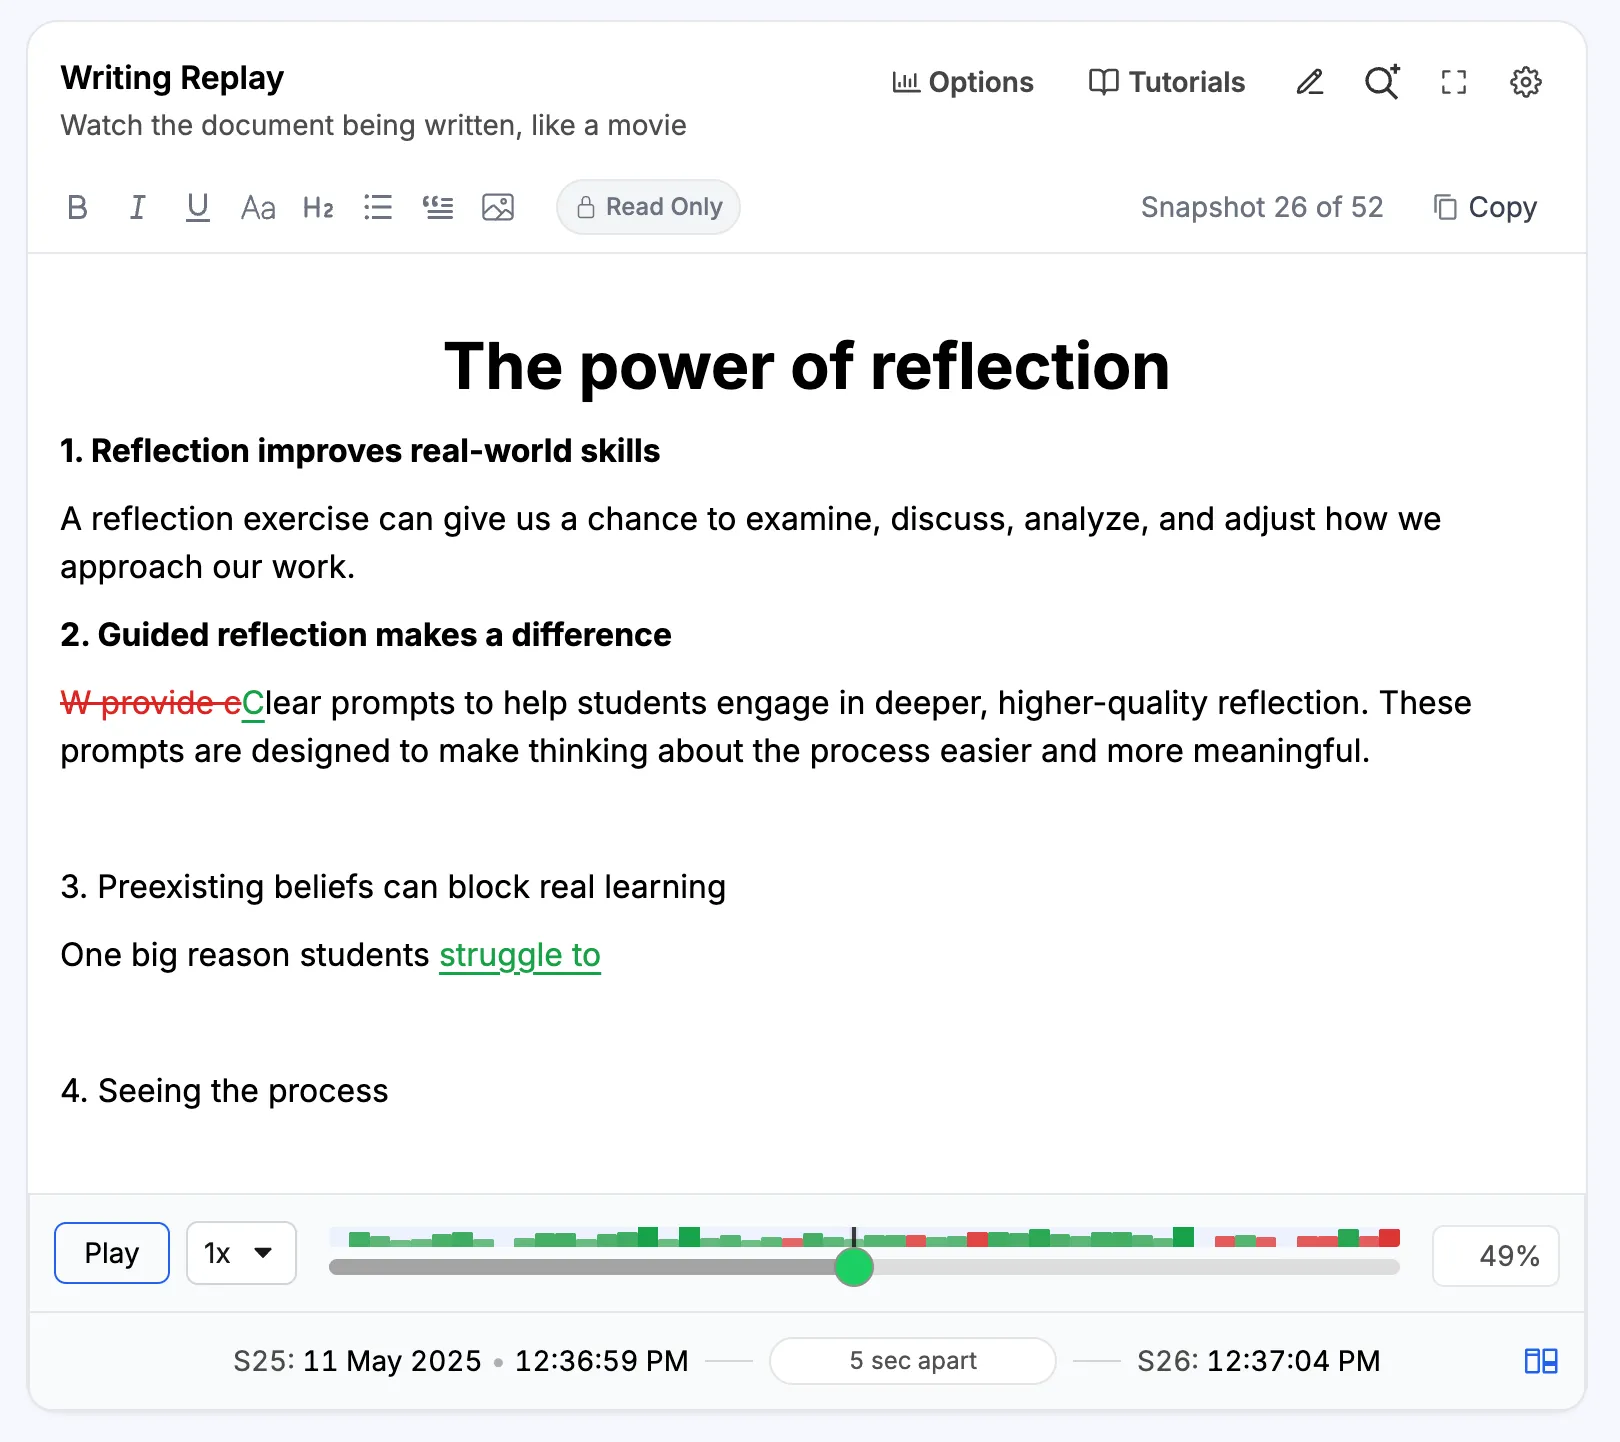
Writing Replay
Watch the document being written, like a movie, from an empty page to the final text
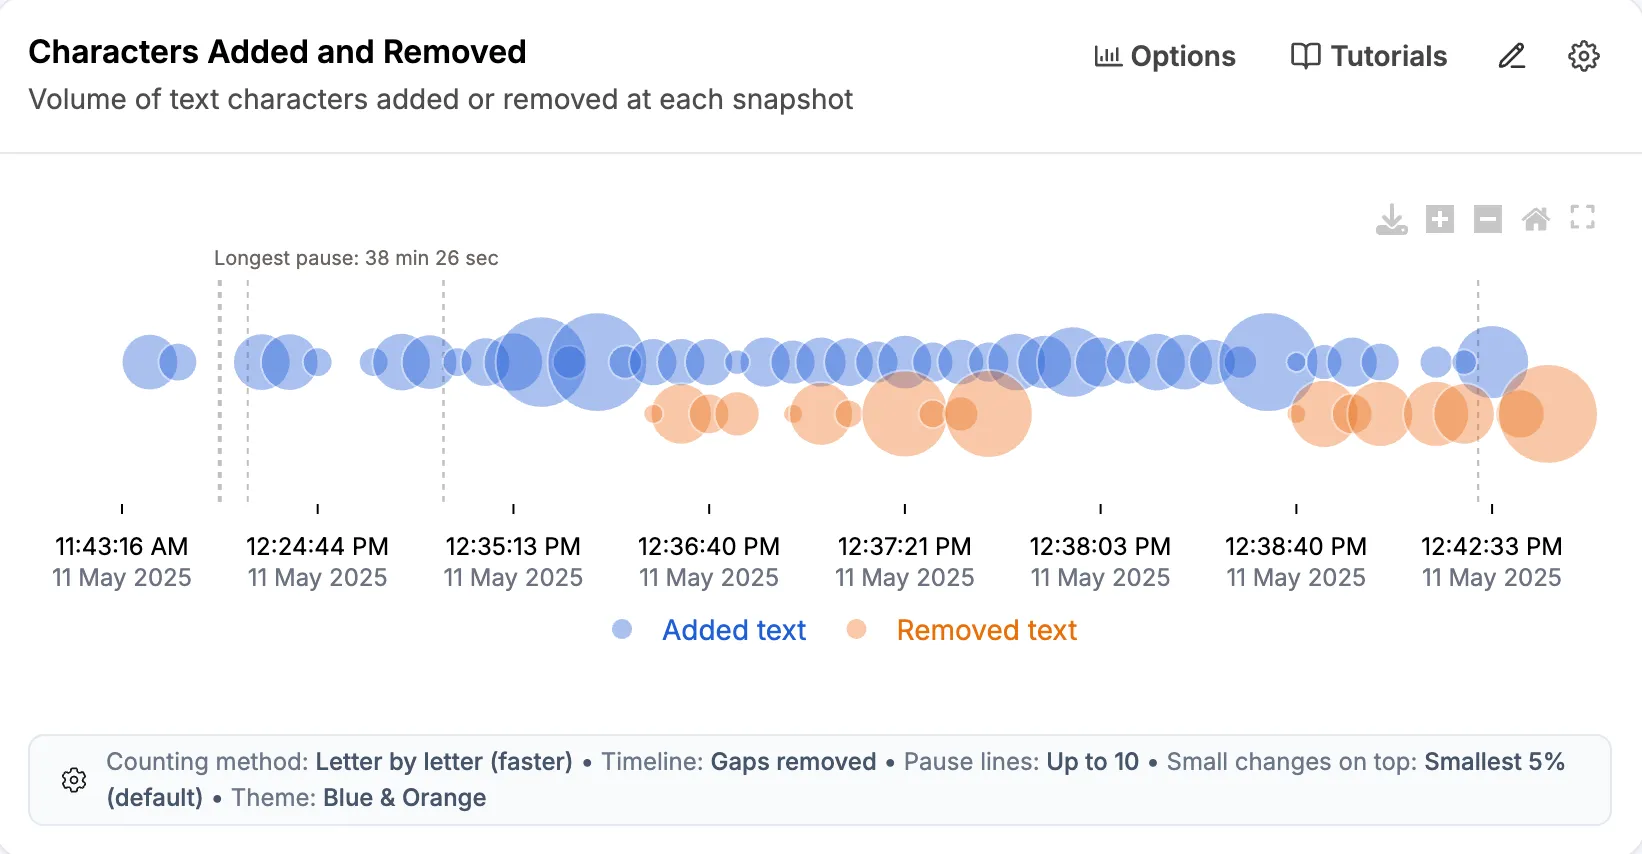
Characters Added and Removed
How much text was added and removed at each snapshot, and where the large changes happened
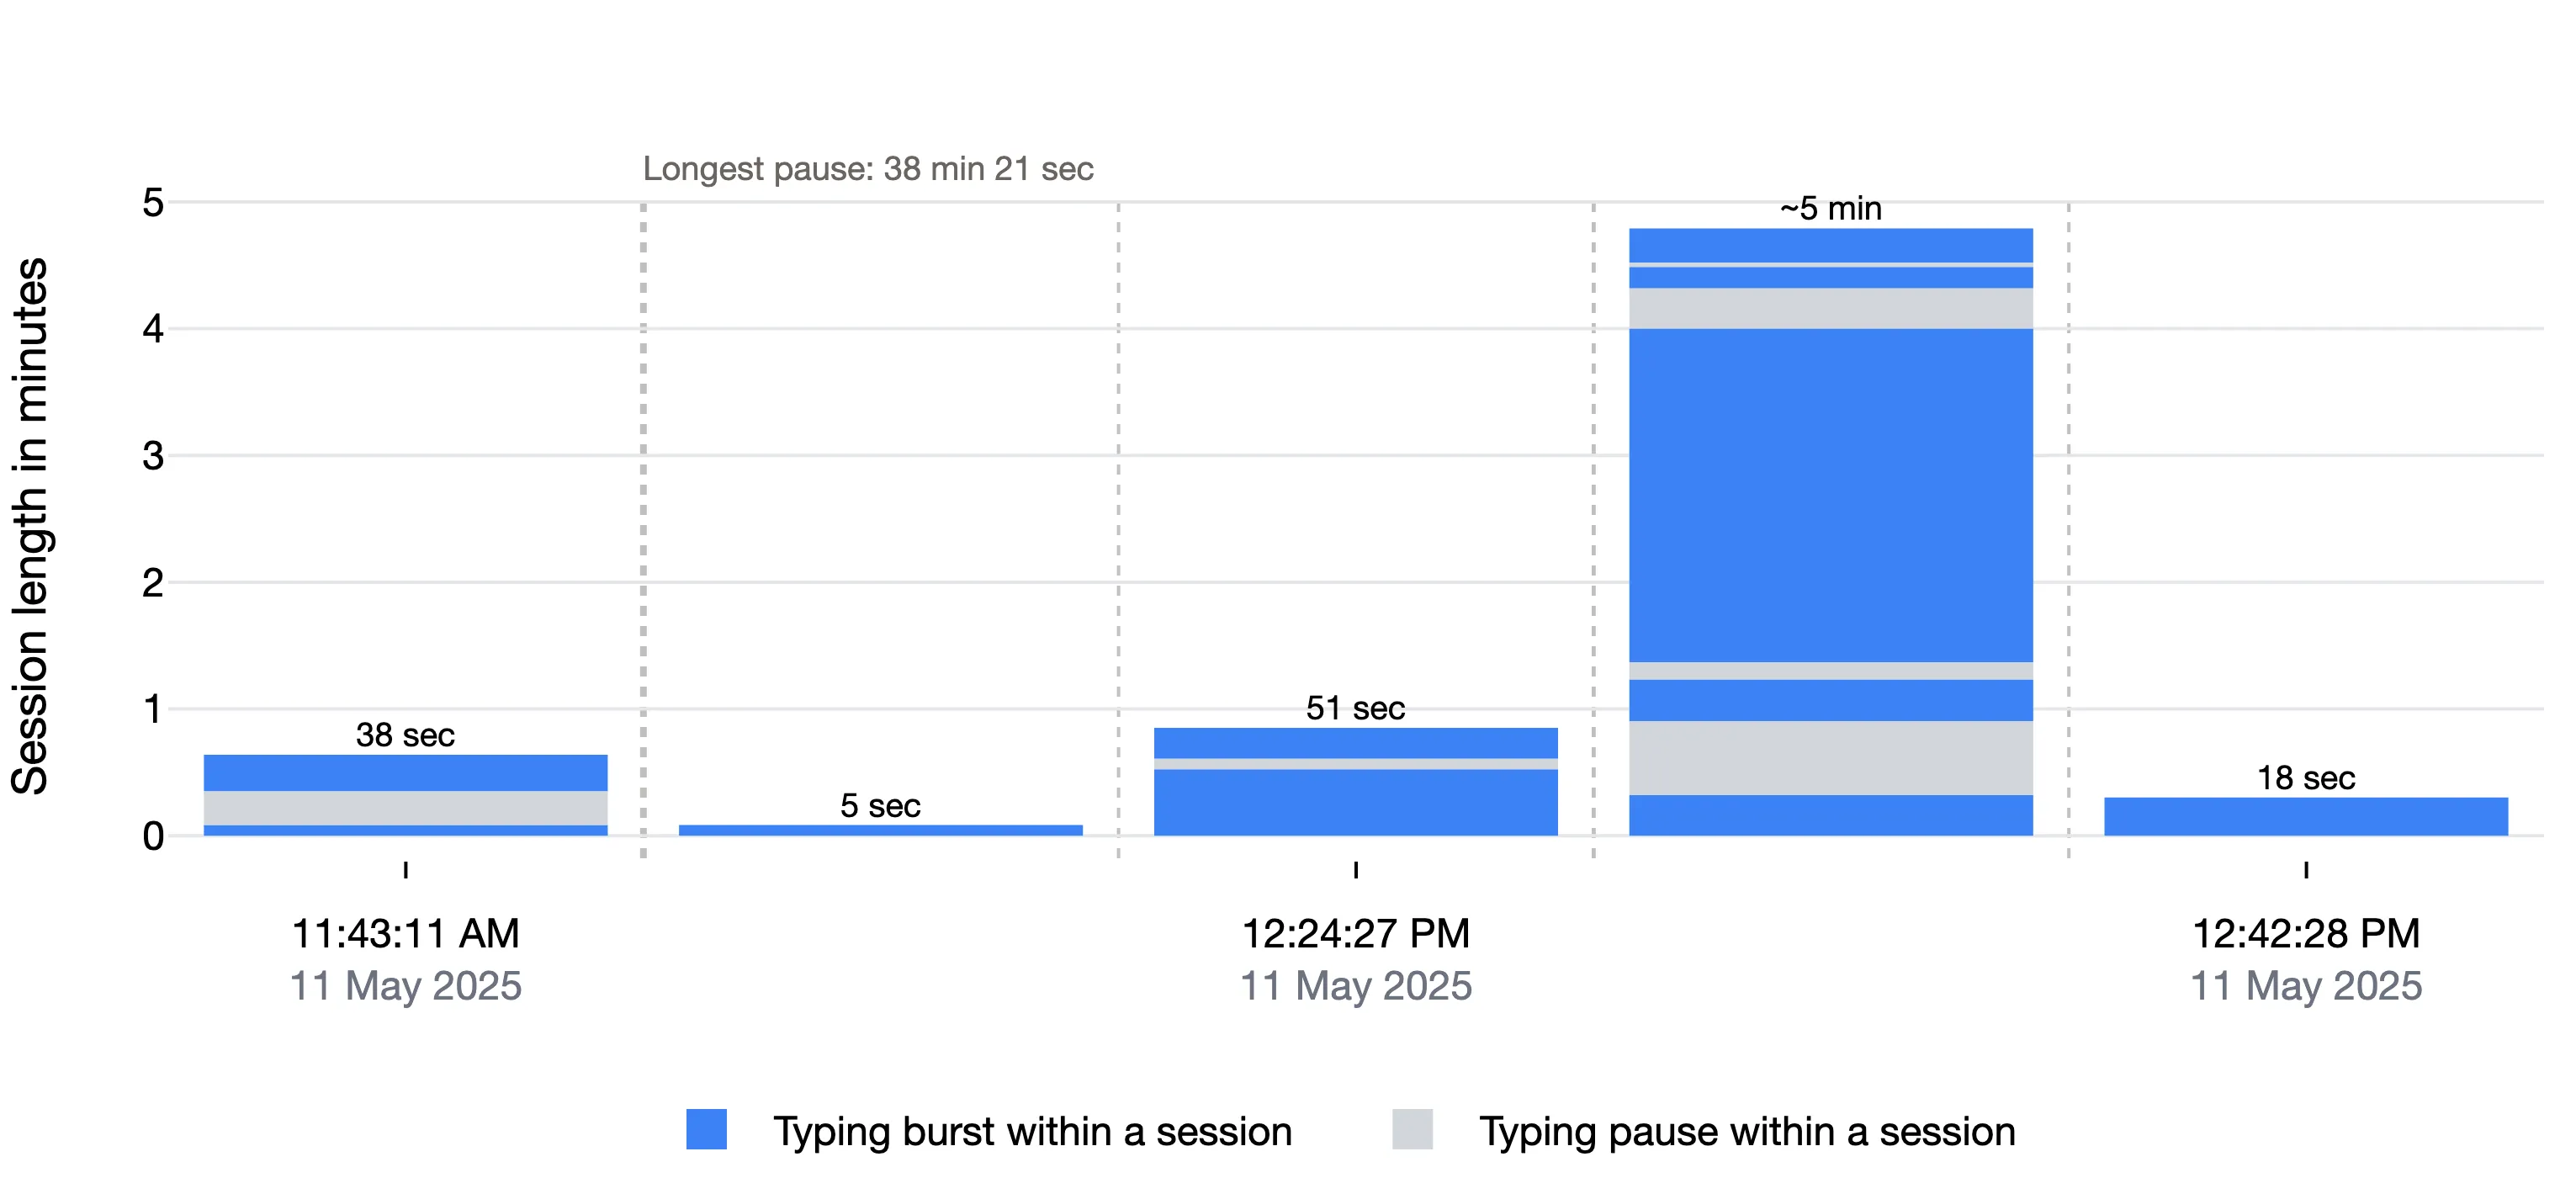
Writing Sessions
Each writing session as a bar, with the typing bursts and short pauses inside it
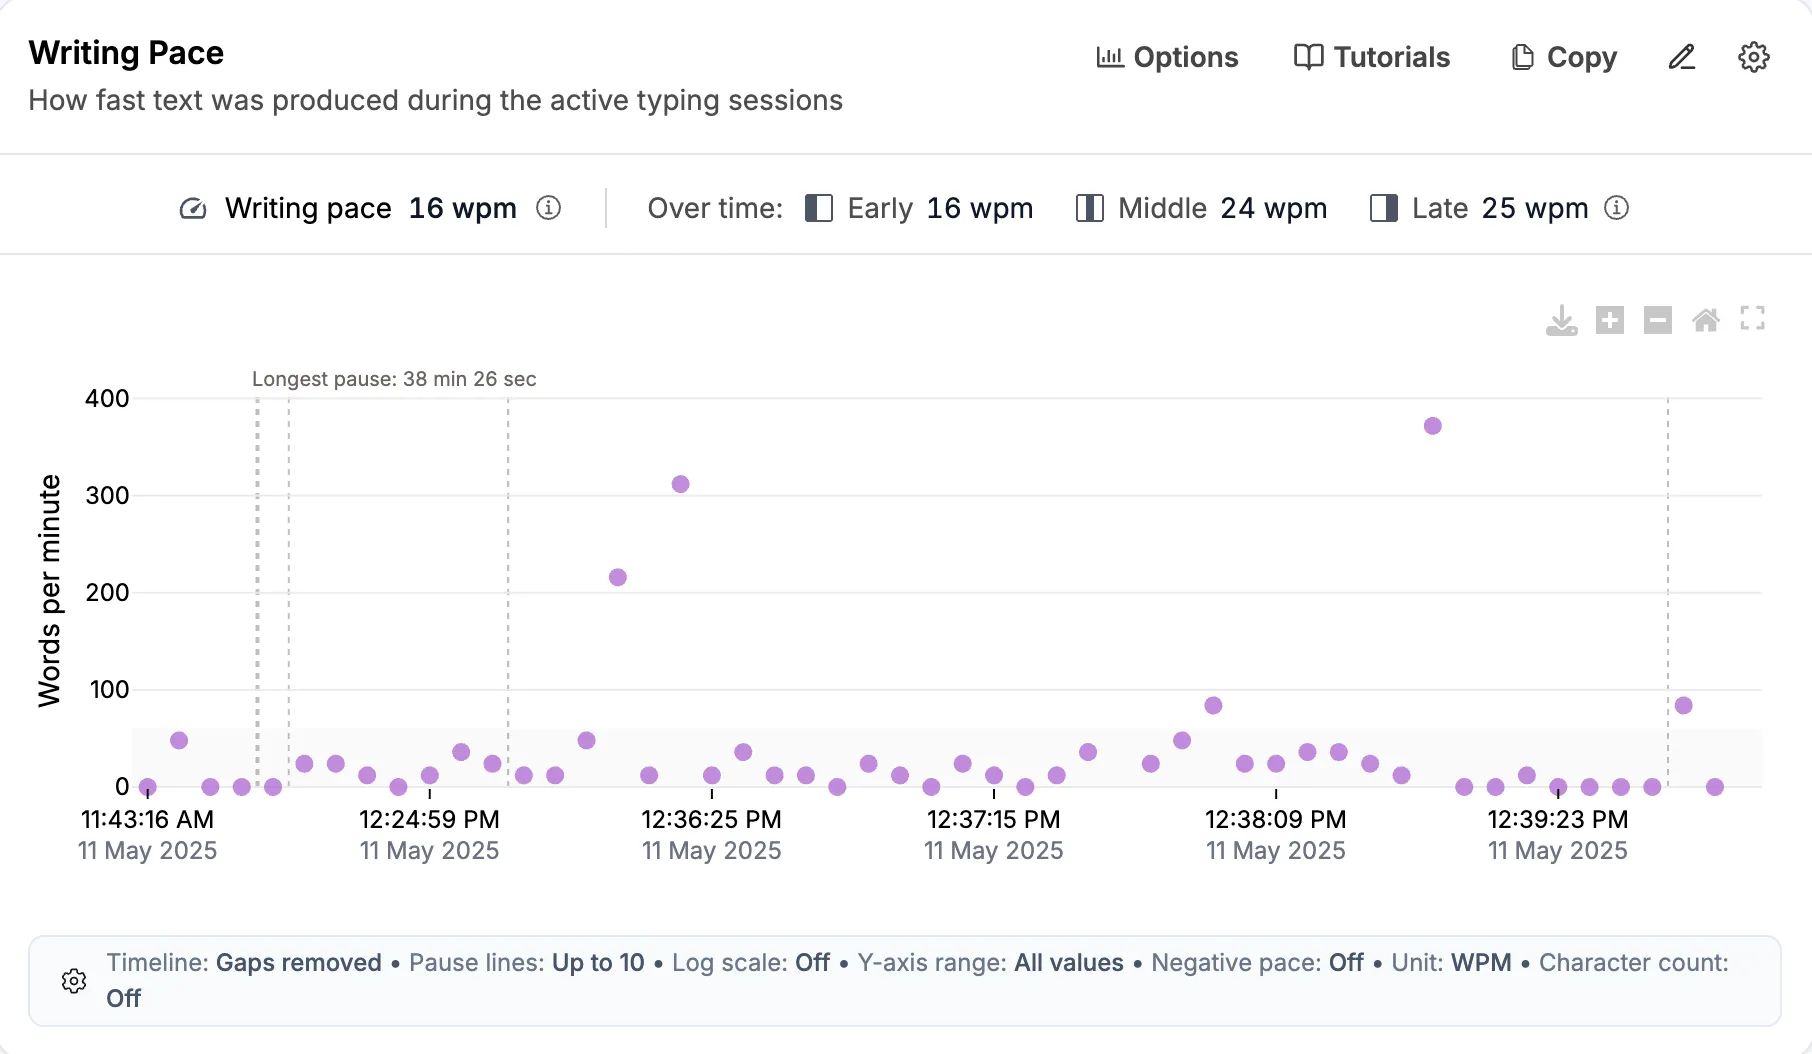
Writing Pace
Typing speed over time
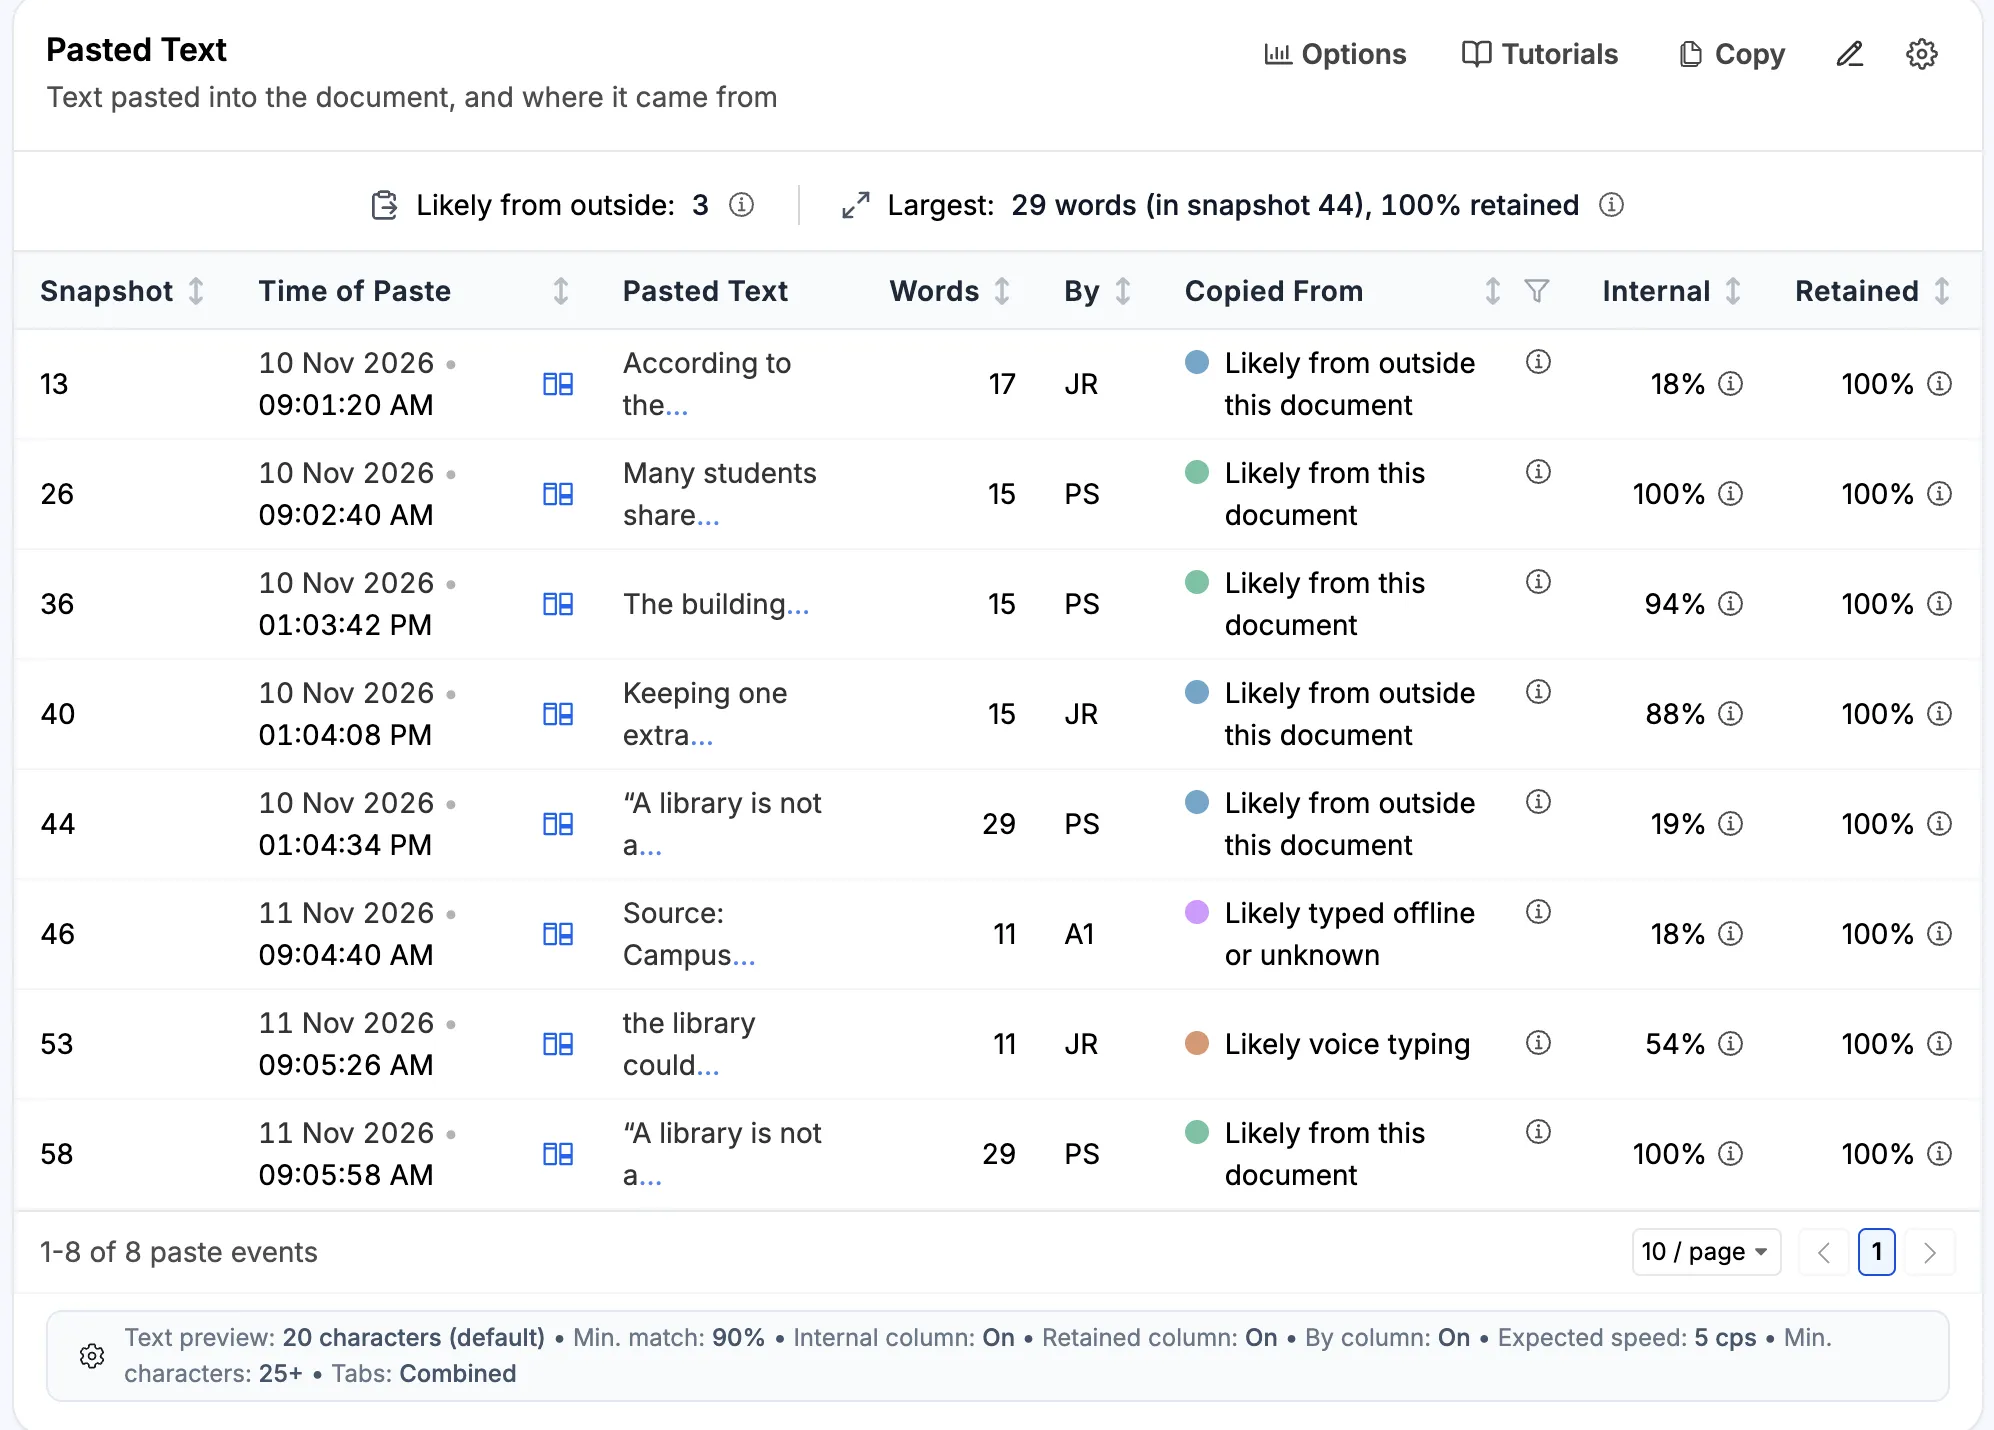
Pasted Text (or Paste-Like Changes)
Each block of text that arrived in the document at once, and where it likely came from
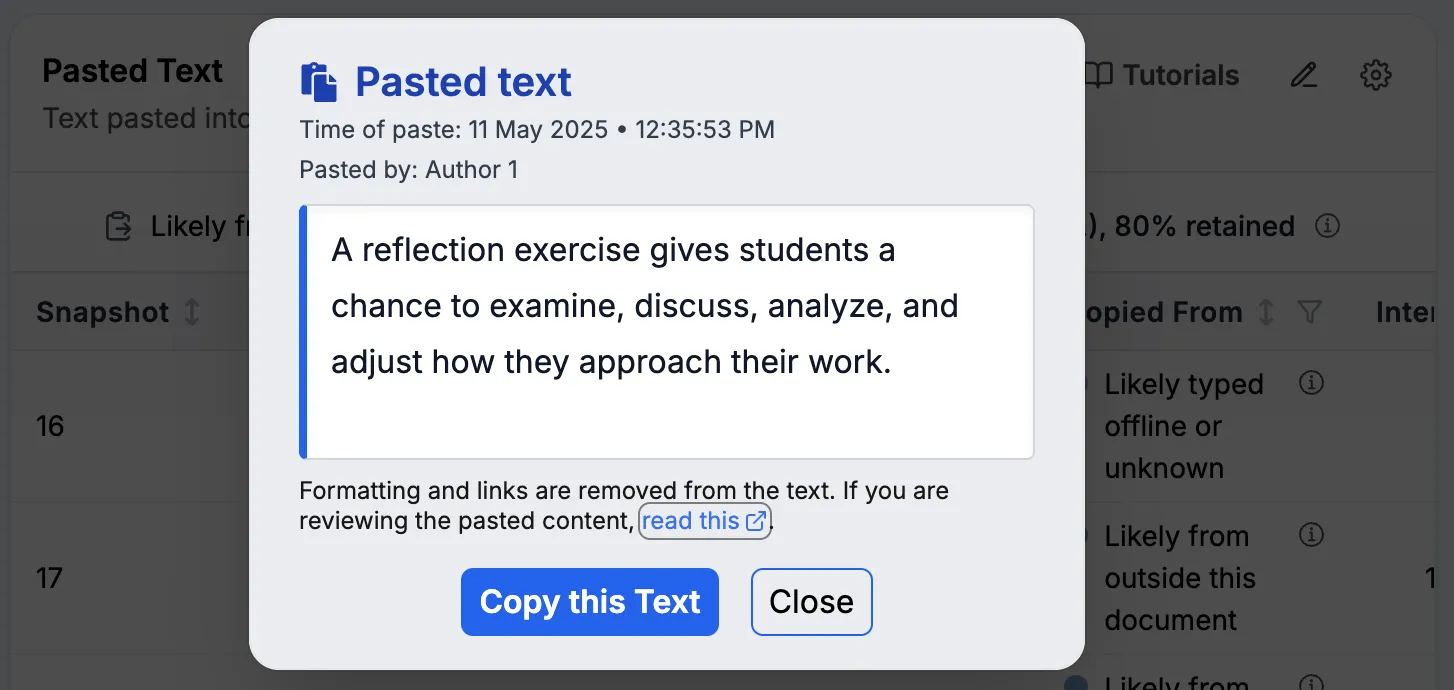
Reviewing pasted content
Learn why pasted text may not appear in the report's snapshots
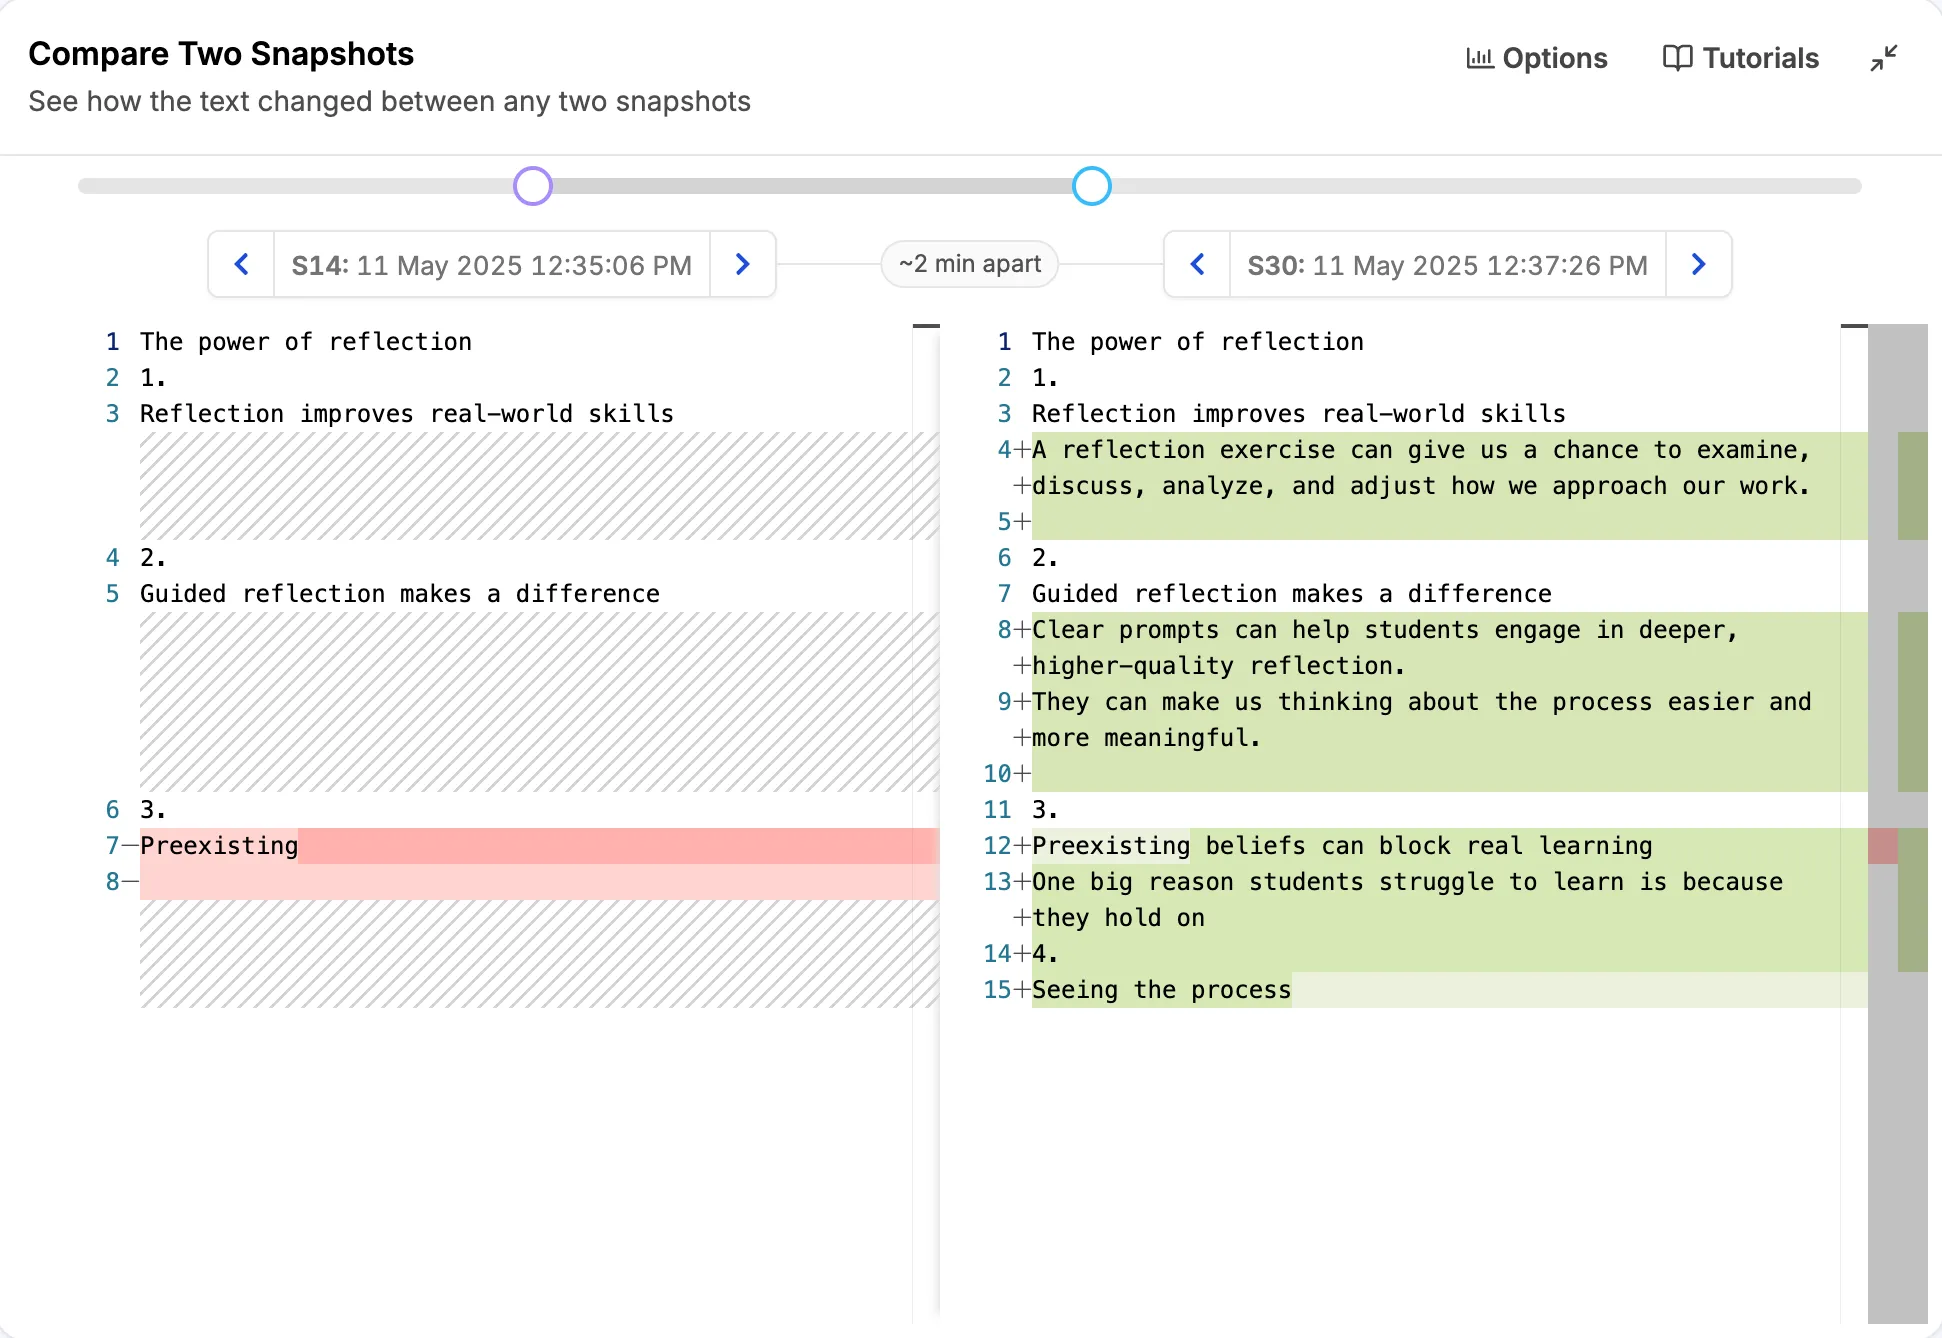
Compare Two Snapshots
The text of two snapshots side by side, with what was removed and what was added
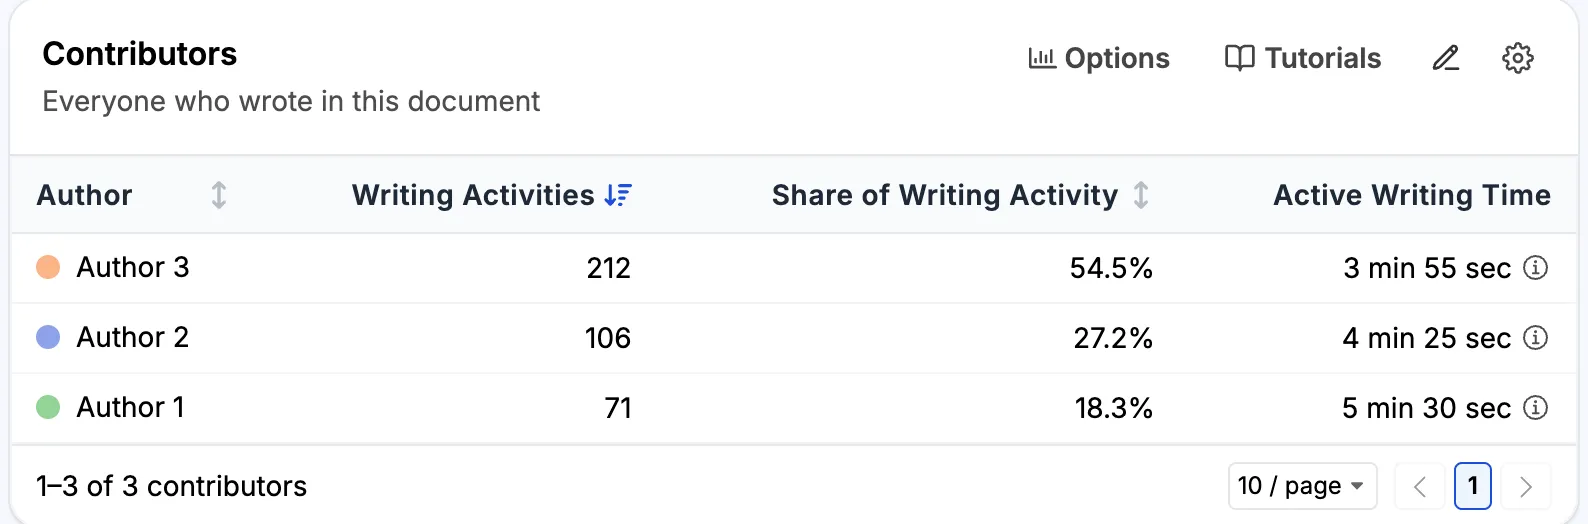
Contributors
Everyone who wrote in a shared Google Docs document, and when
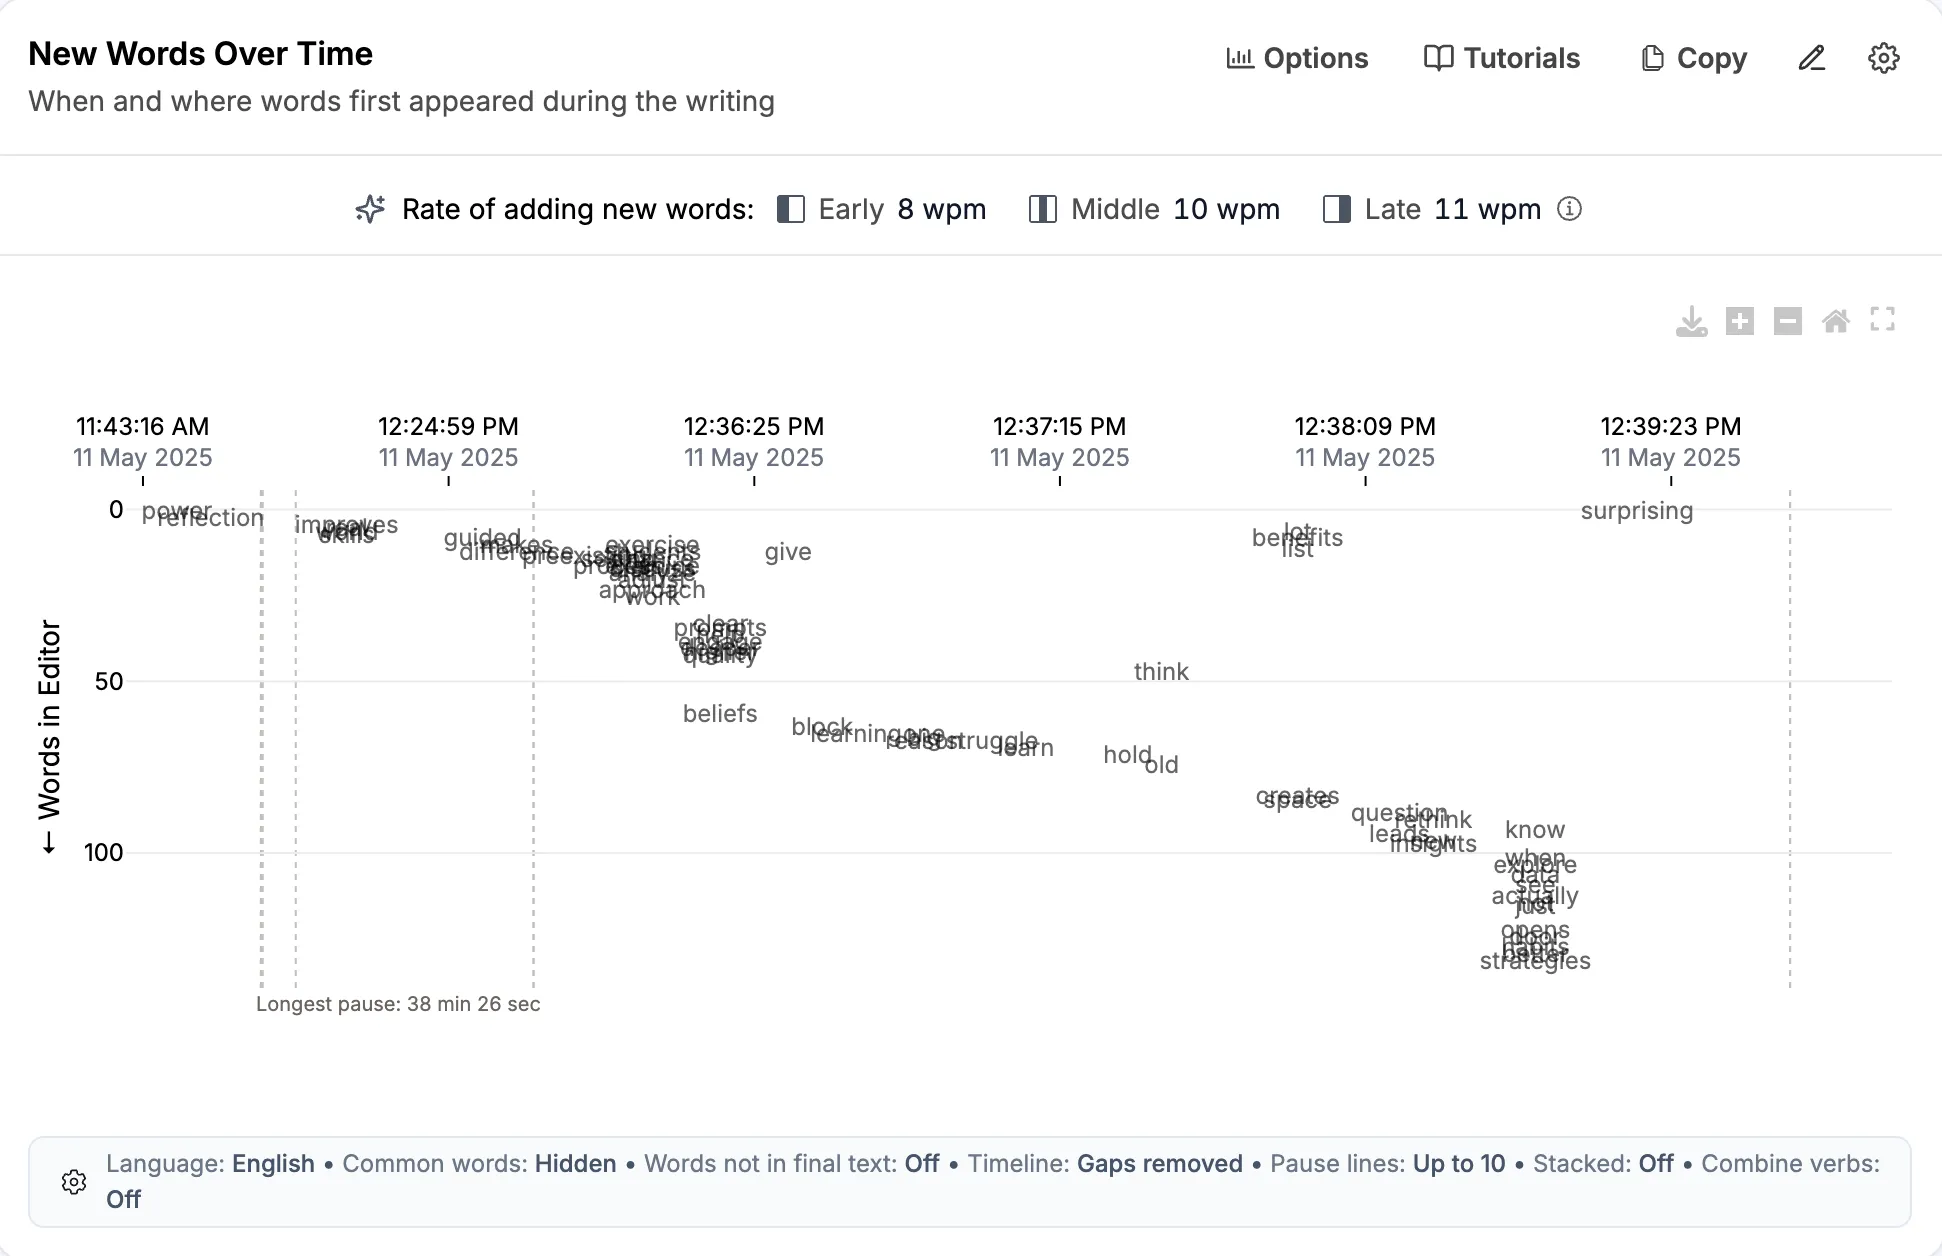
New Words Over Time
When and where each word first appeared during the writing, and which parts of the text the writer went back to
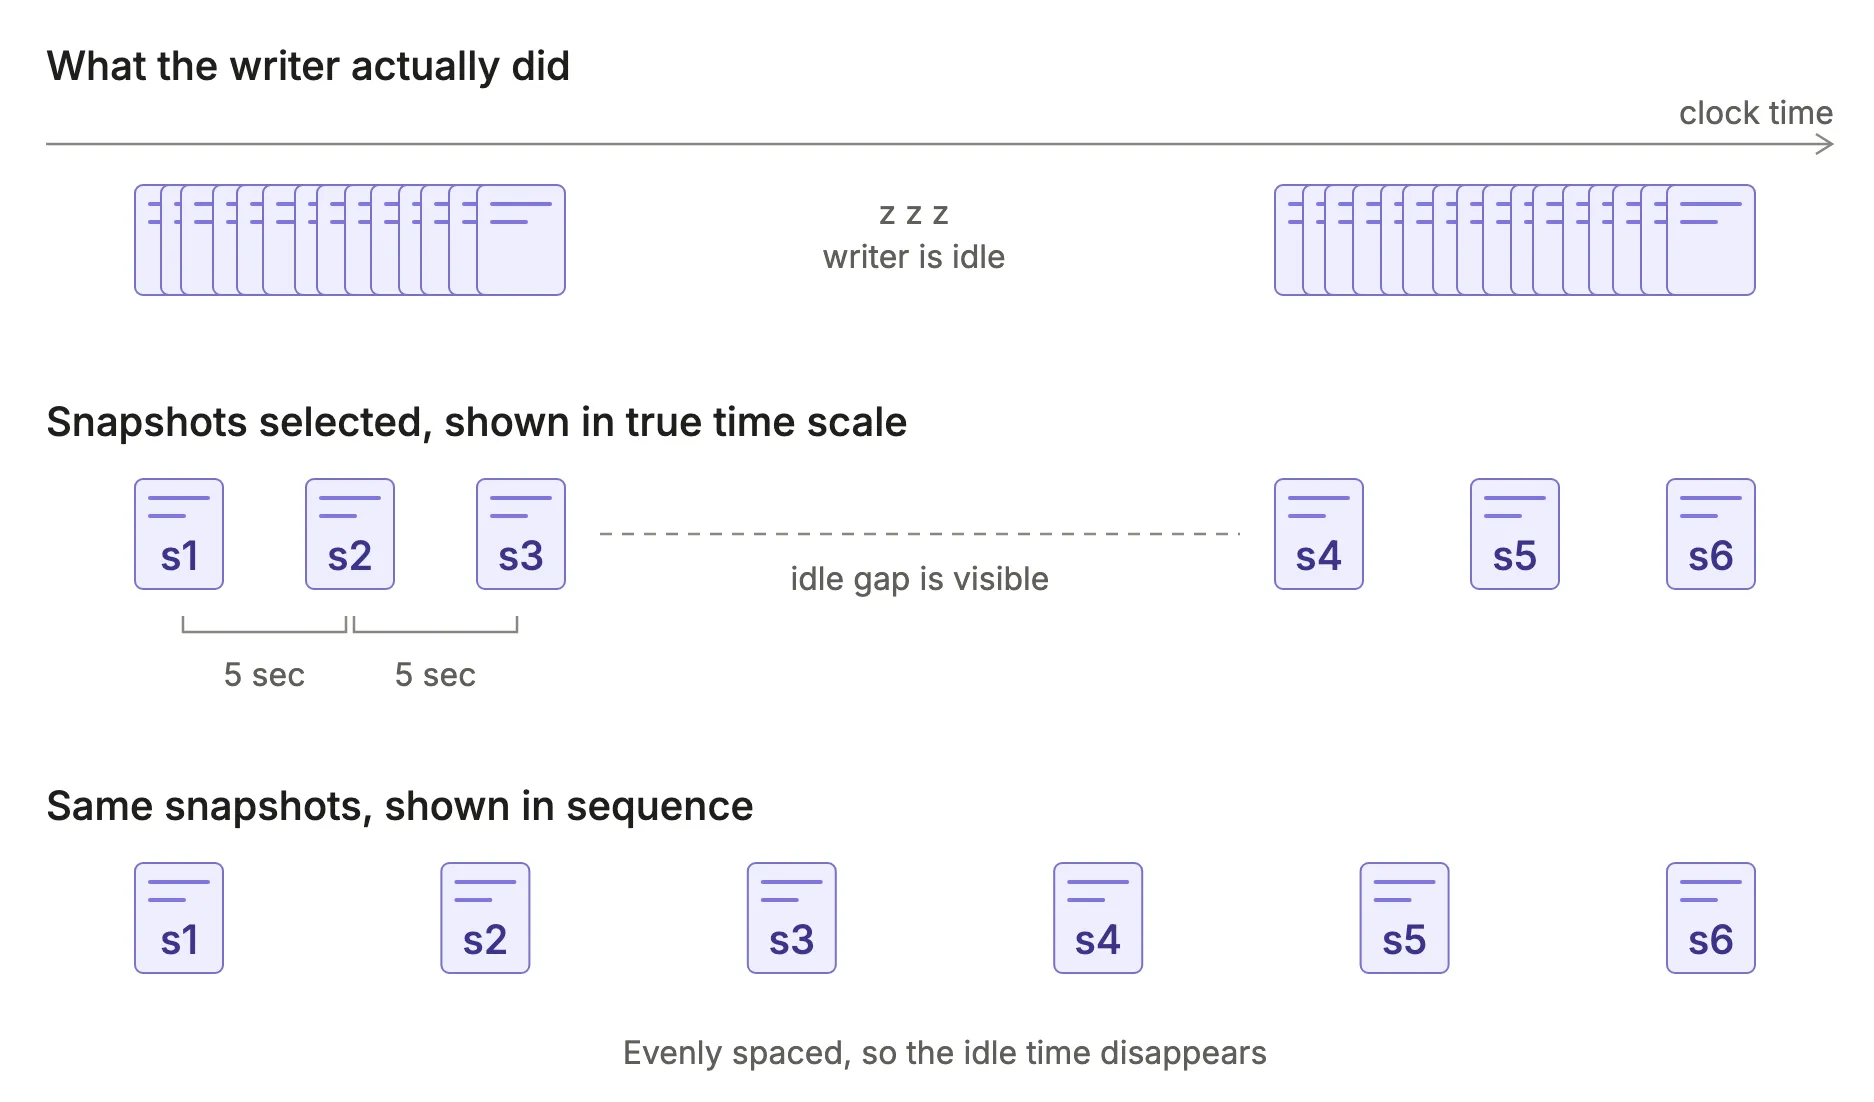
What is a snapshot?
Read why snapshot count matters in a writing process report
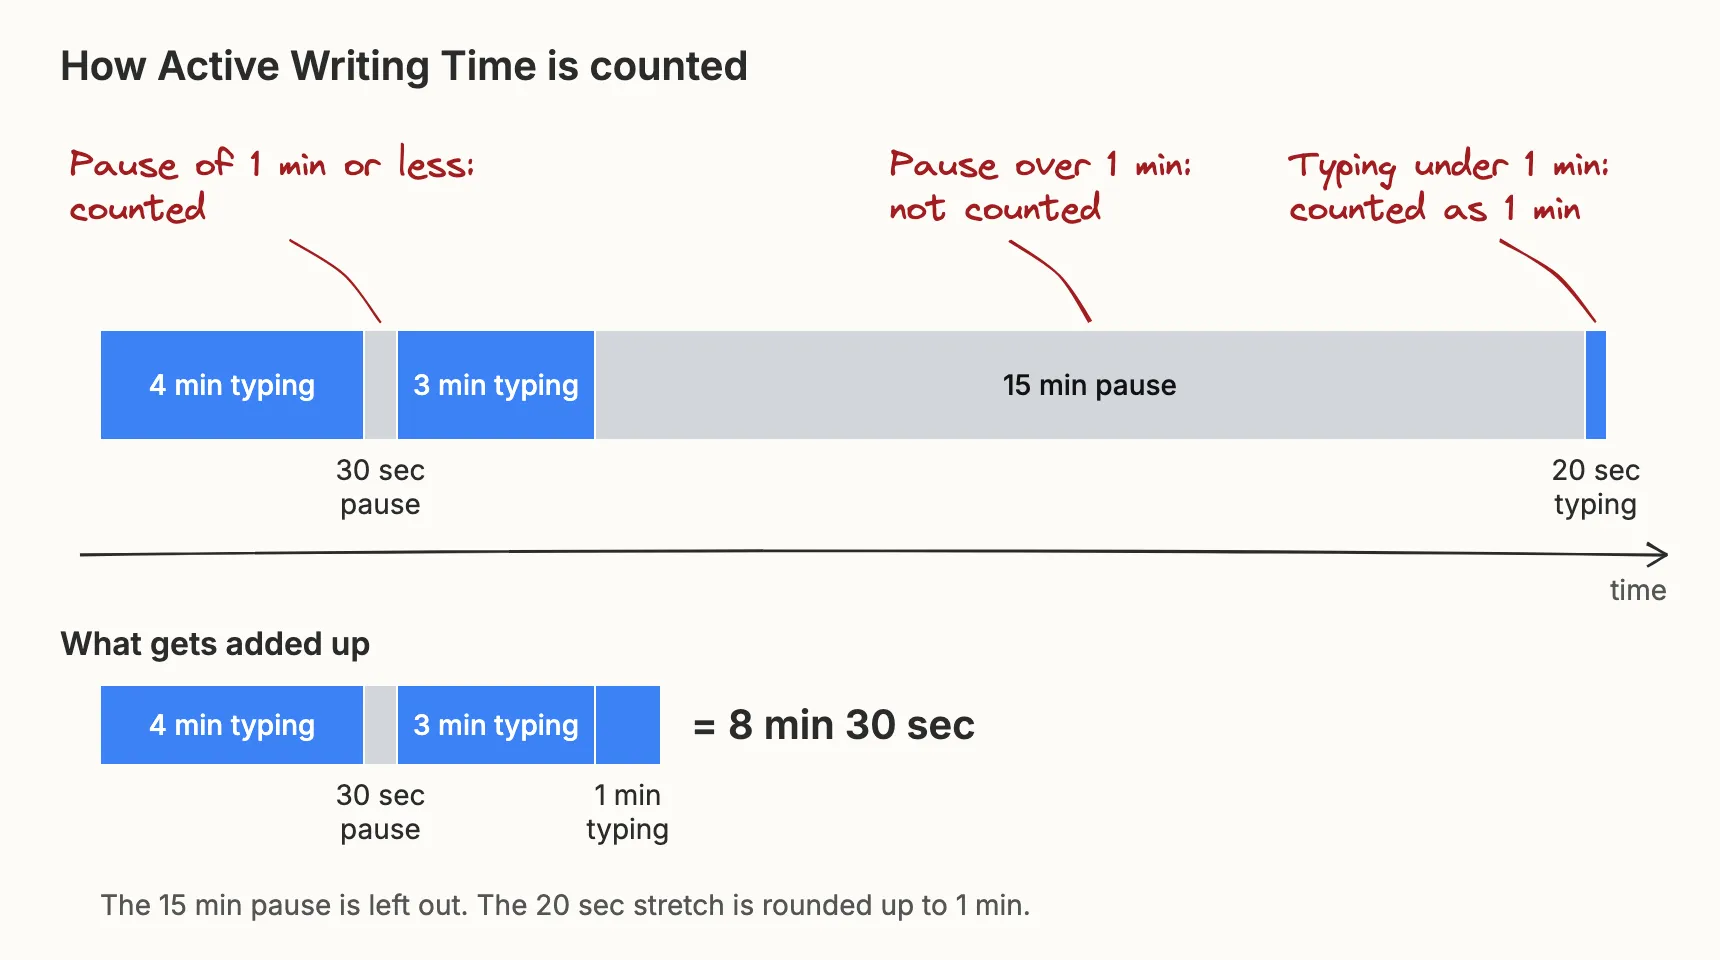
Active Writing Time
How the report adds up the time spent typing, and what the number can and cannot tell you.
Glossary
Definitions of the terms used throughout the writing process report.