New Words Over Time shows each word of the text at the moment it first appeared, and at the place in the document where it appeared. It shows the order in which the vocabulary of the text came together, and the moments when the writer went back to add words to an earlier part.
A. Annotated figure
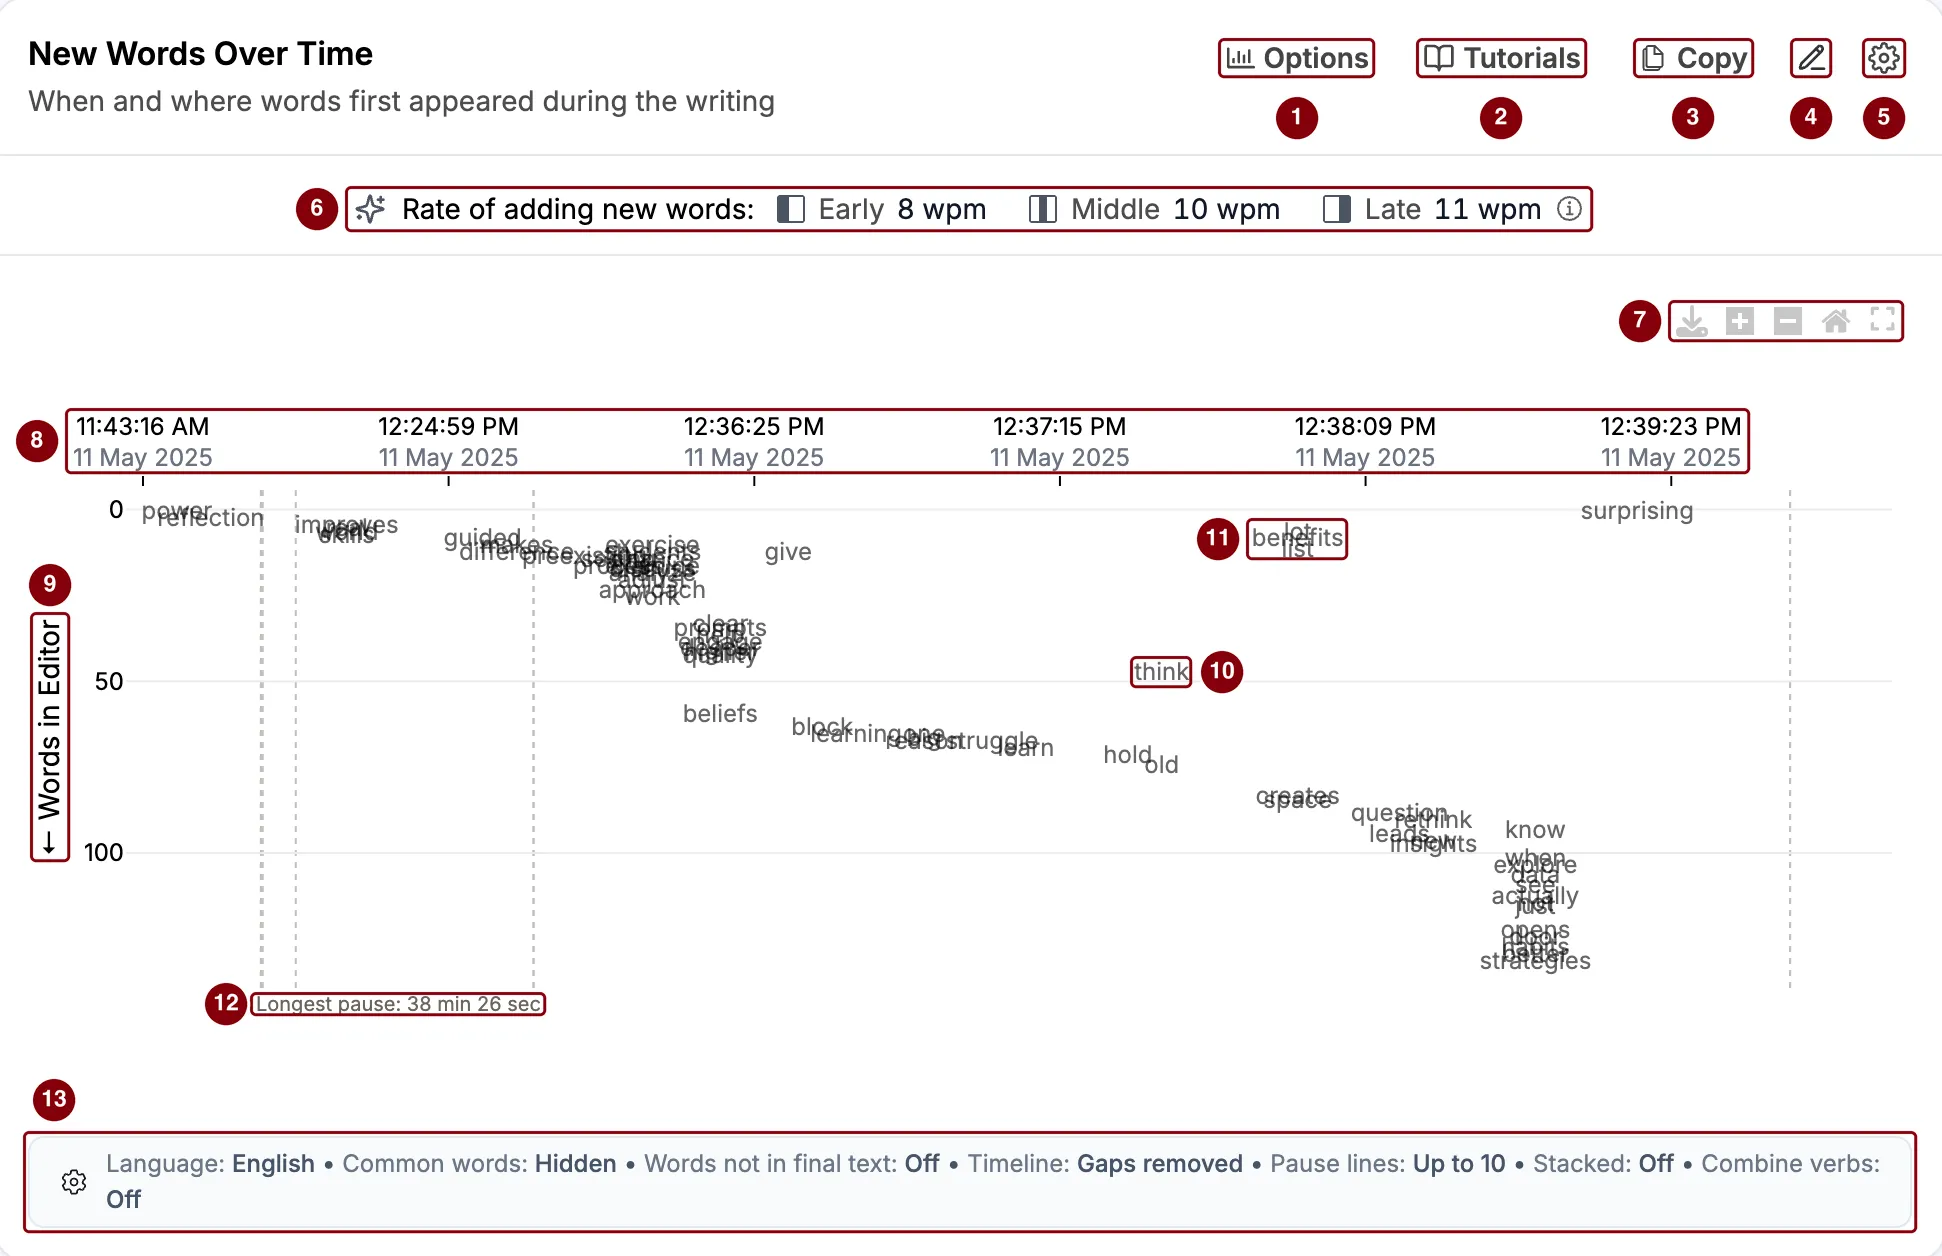
Buttons at the top
- Options changes which words are shown and how. See C. Options.
- Tutorials opens tutorials and help for the report.
- Copy copies this section’s data and chart to use in another app.
- Add note lets you write a comment on this section that travels with the report.
- Layout options let you minimize the section or move it up or down in the report.
The chart
- The summary row shows how fast new words were added, early, in the middle, and late in the writing. See The summary row below.
- The chart toolbar lets you download the chart as an image, zoom in and out, reset the view, and show the chart on the whole screen.
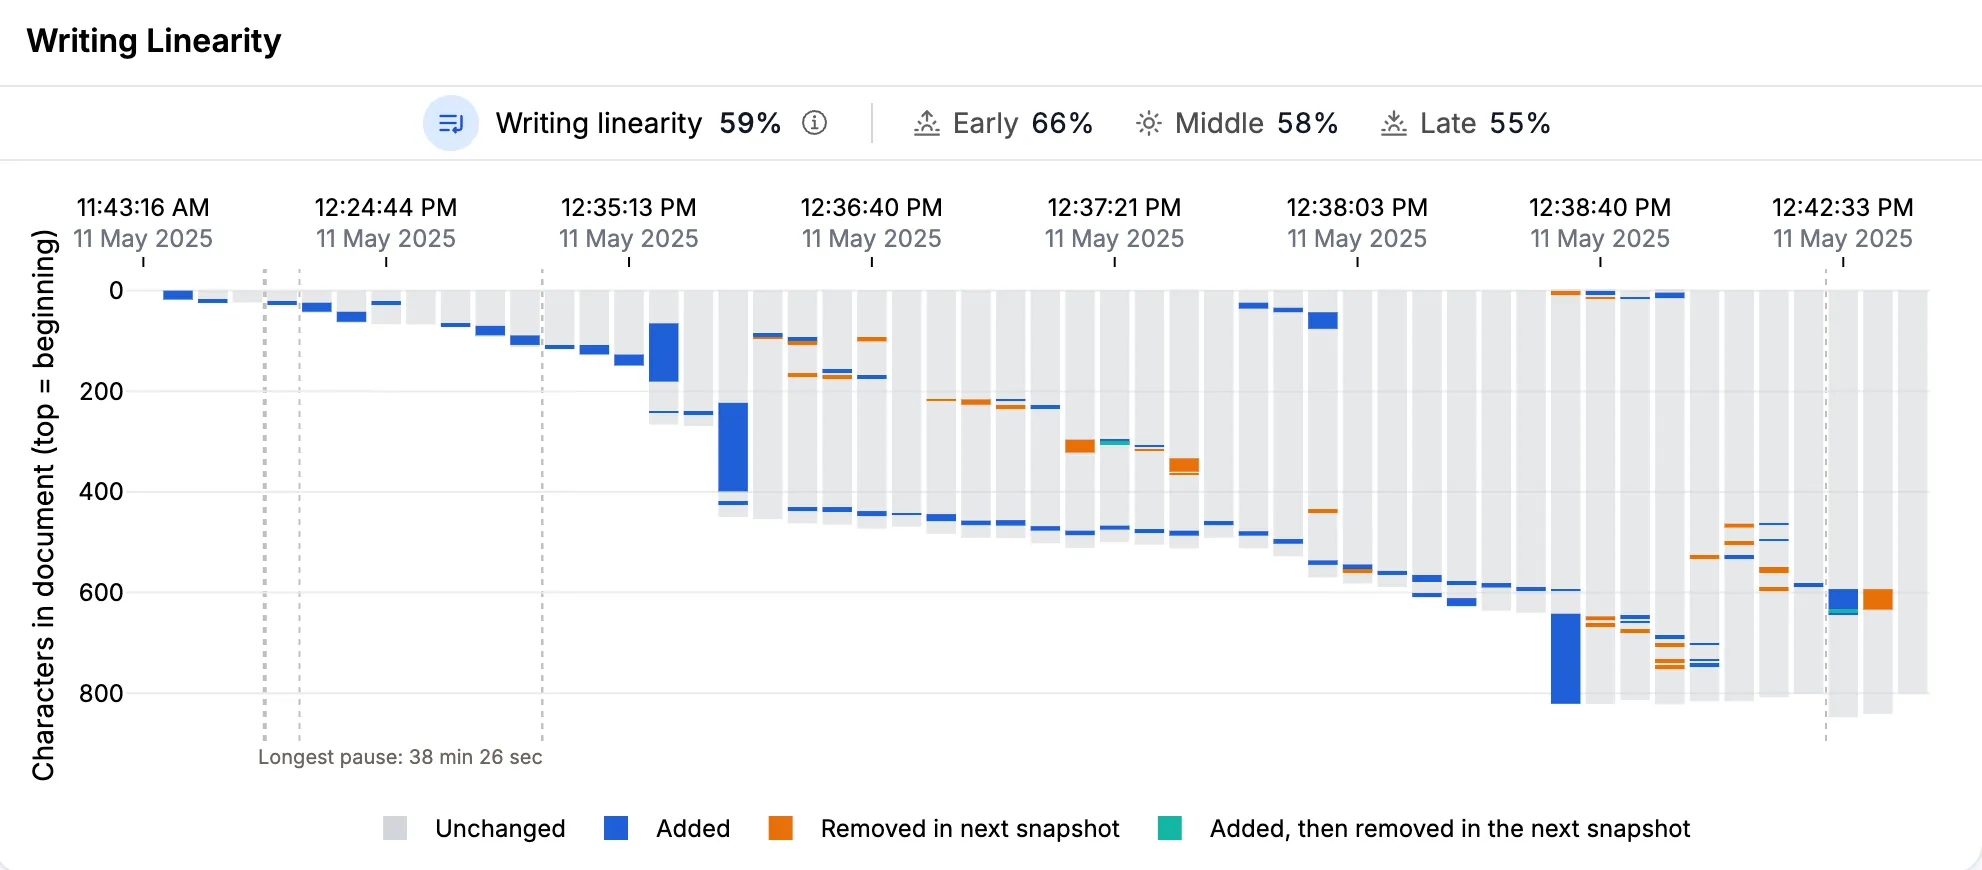
- The snapshot times run along the top, from left to right. By default, the snapshots are placed one after another, so a long pause takes up no space.
- Words in Editor is the place of a word in the document when it first appeared, counted in words from the start. The start of the document is at the top.
- A word in the middle of the document, here “think”, that appeared later than the words around it.
- Words near the start of the document, here “benefits”, “lot”, and “list”, that appeared near the end of the writing.
- The longest pause is labeled at the bottom. The dashed lines mark the longest typing pauses.
- The settings bar shows the current settings without opening Options.
B. How to read the chart
1. The summary row
Rate of adding new words shows how many new words were added per minute of active writing, in the first, middle, and last third of the snapshots. Here, it is 8, 10, and 11 words per minute (wpm).
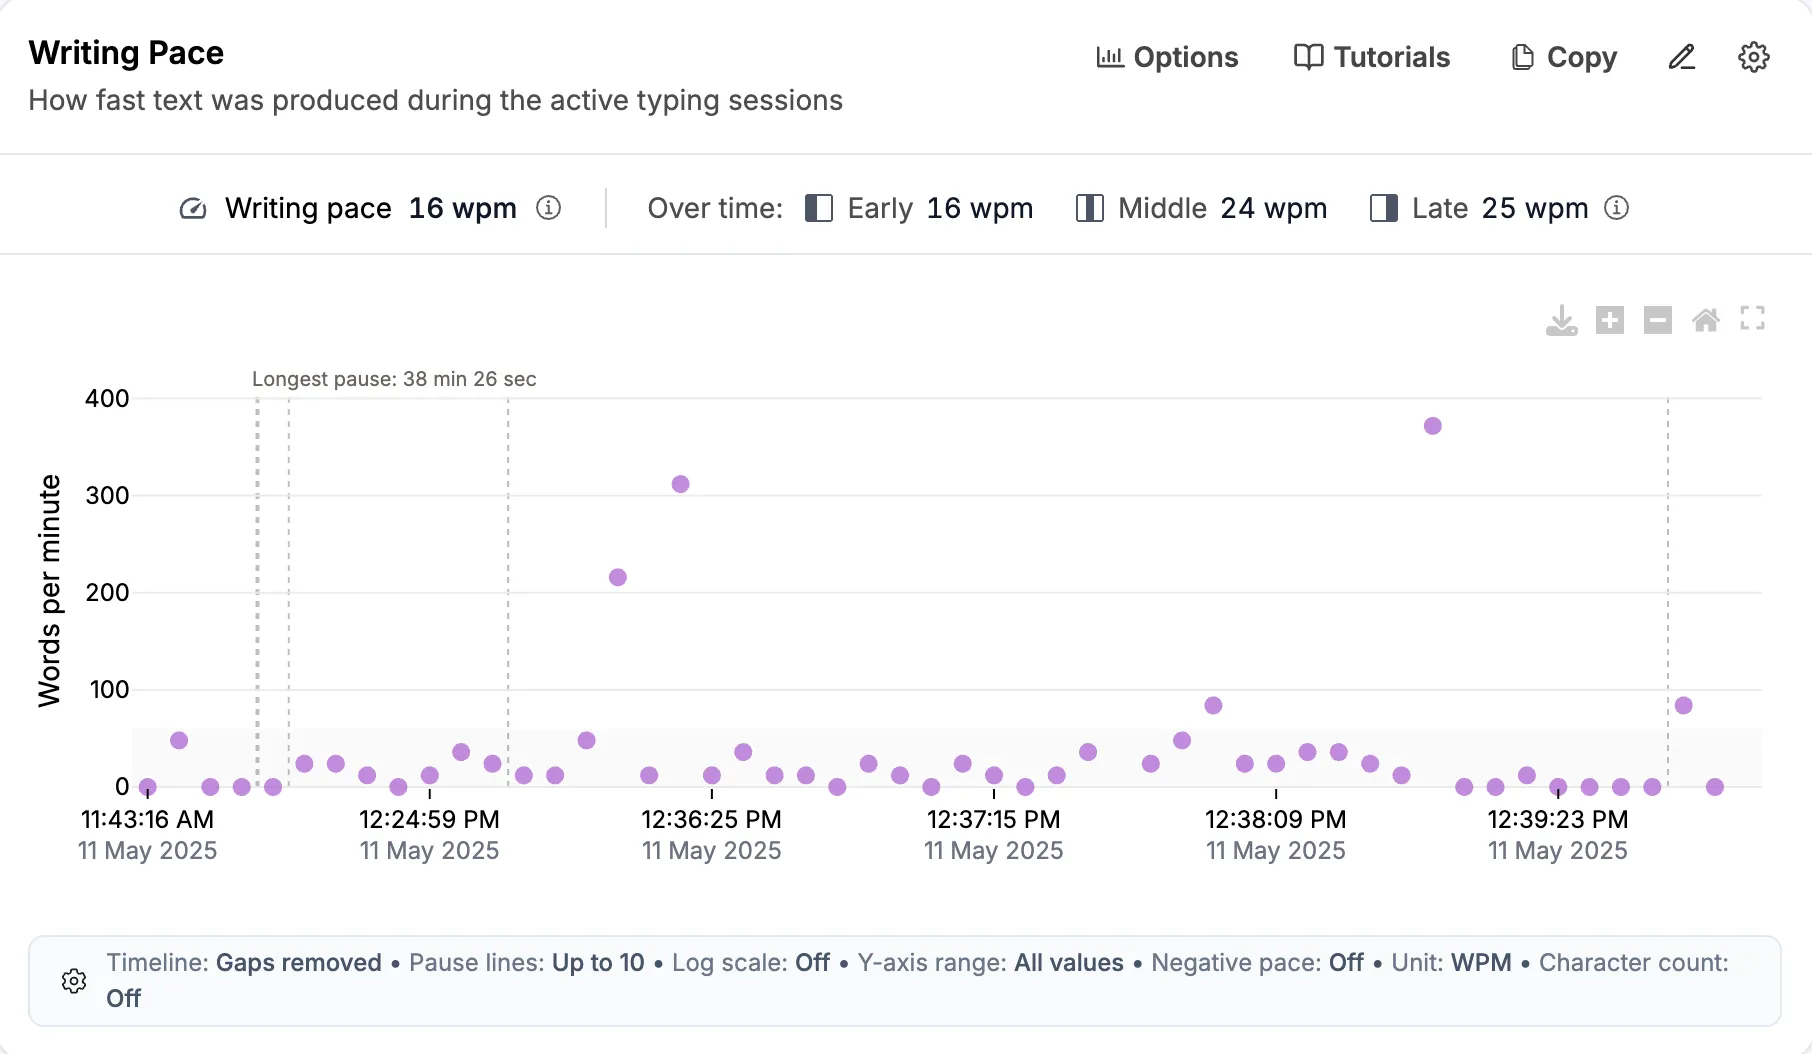
A new word is one the chart shows. Each word counts once, the first time it appears, and the options decide which words count. So this is not the same as Writing Pace, which counts every word. In the same document, the writing pace is 16, 24, and 25 wpm.
The thirds follow the writing over time, not the beginning, middle, and end of the document. Words already in the first snapshot are not counted. A large paste raises the rate of its third. With fewer than three snapshots, the thirds show a dash.
2. Each word sits where and when it first appeared
- Across, a word sits at the snapshot where it first appeared.
- Down, a word sits at its place in the document at that moment, counted in words from the start. A word at 50 was the 50th word or so of the text when it appeared.
The words are written on the chart instead of dots. Each word appears only once, even if it is used many times in the text.
3. Look at the diagonal, then at the words off it
A diagonal from top left to bottom right means the writer wrote in order. Words near the start appeared early, and words further down appeared later. Most of the figure follows this shape.
Words above the diagonal were added to an earlier part of the document later in the writing. In the figure:
- “benefits”, “lot”, and “list” sit near the top of the document but appeared at about 12:38 PM, near the end of the writing.
- “surprising” sits at the very top and appeared last of all.
- “think” sits close to word 50 but appeared after the words around it.
These are places where the writer went back to the opening or the middle to add something. This is ordinary revision, and often a sign of a writer who rereads their work.
Words stacked at one moment mean many new words arrived at once. This is usually a burst of writing, and sometimes a paste. Check Pasted Text at the same snapshot.
4. Which words are shown
By default, the chart shows a word only if:
- it is made of the letters A to Z and is longer than two letters,
- it is not a common word, such as “the”, “and”, or “with”,
- it is still in the final text.
So numbers, short words, and words with accented letters are left out. Words that were written and later removed are hidden, unless you turn them on in Options. In the figure, snapshot 2 ended with the half-typed word “refle”. It is not in the final text, so it is not shown.
5. Hover and click
Where many words appeared at once, their labels overlap. Use the zoom buttons in the chart toolbar to read them, or switch to the table.
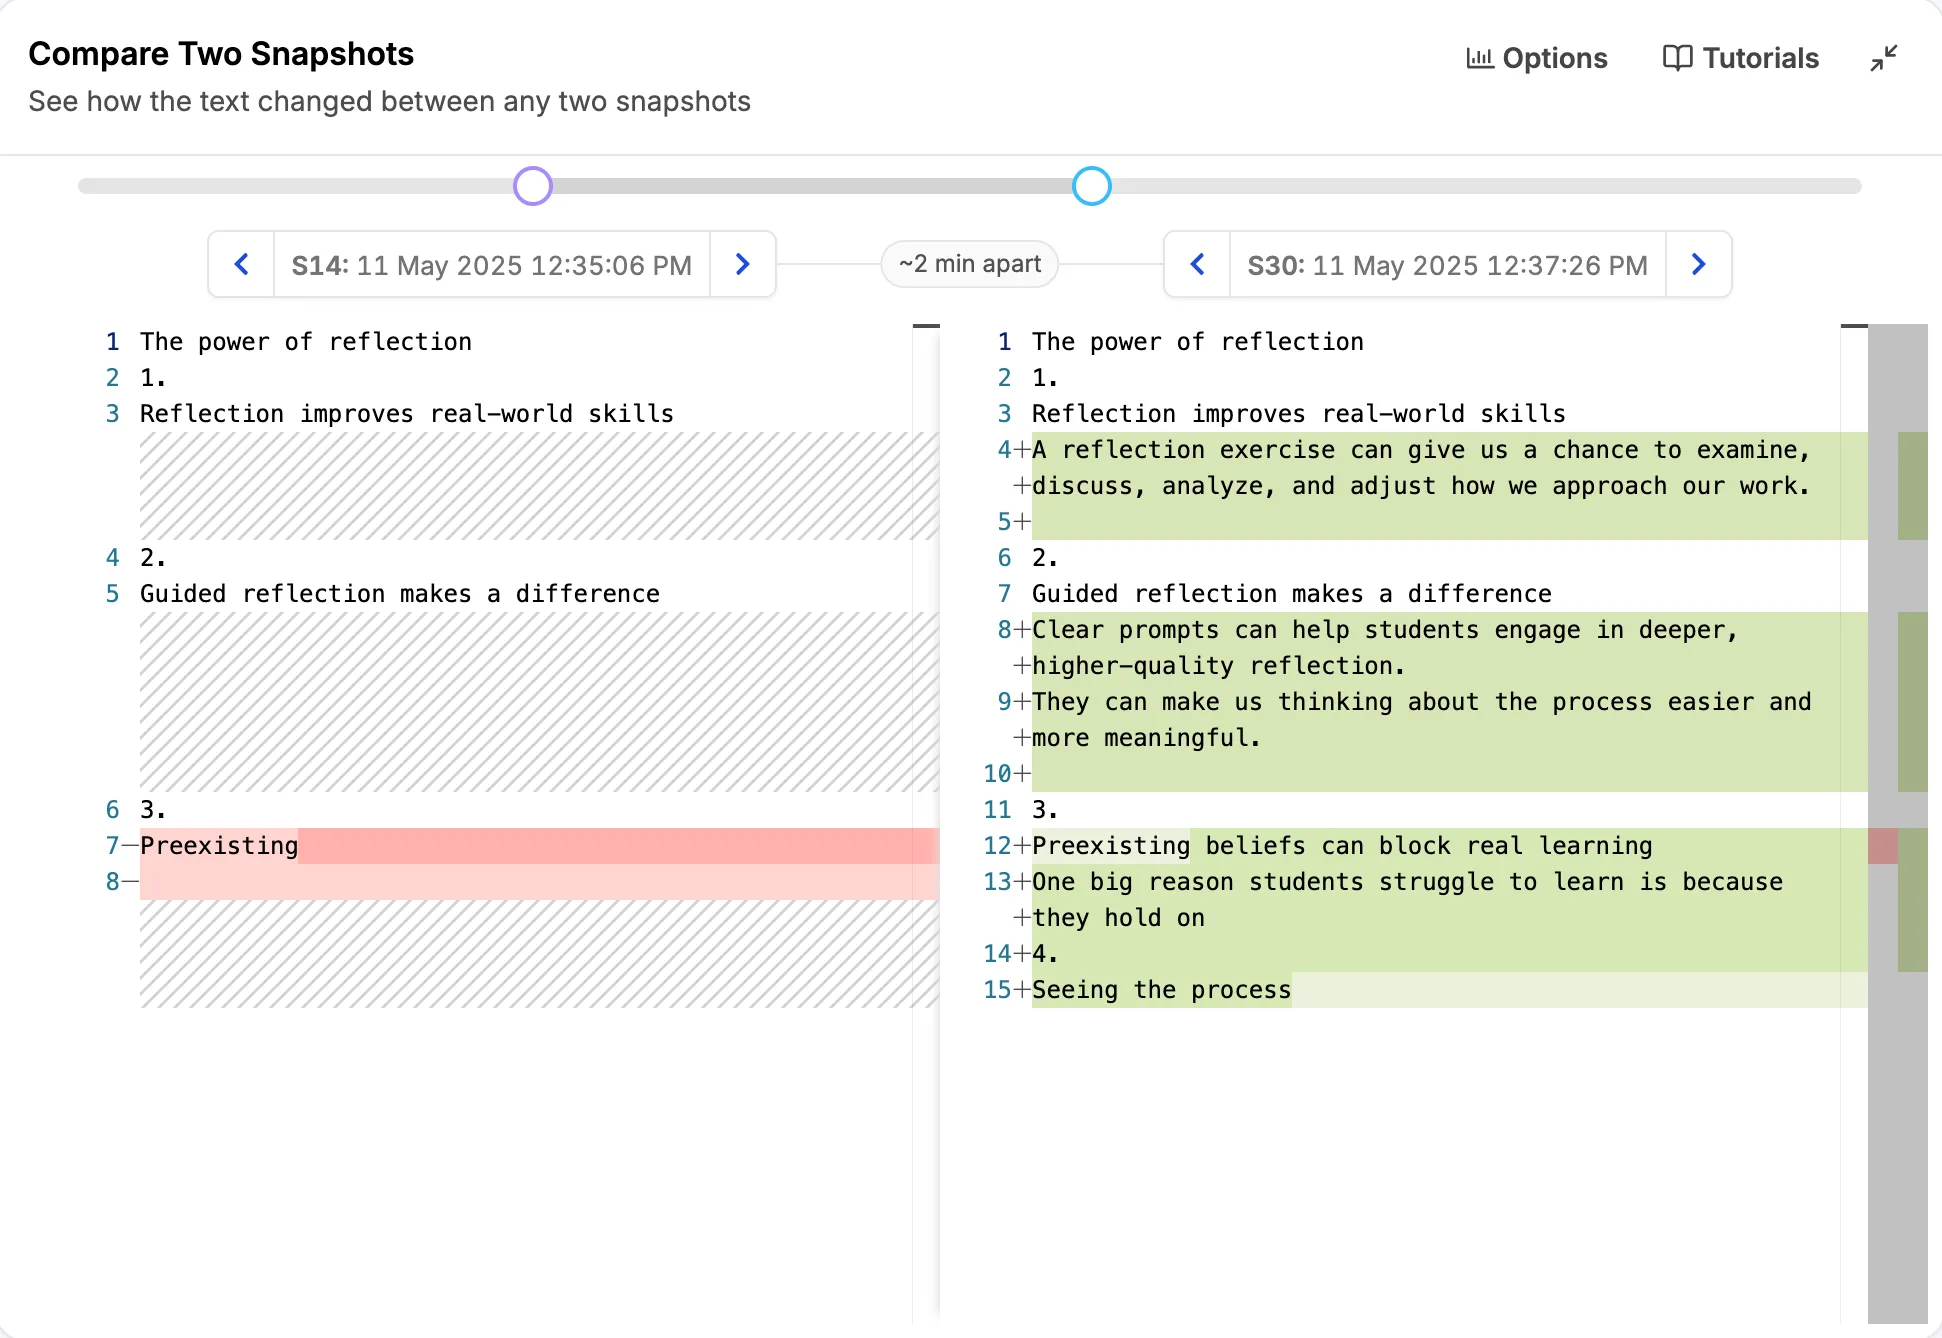
Hover over a word to see it, the time it first appeared, and its snapshot number. Click a word to jump to the Compare Two Snapshots section of the report. It opens on the snapshot where the word first appeared and the one before it.
6. Pauses and the red icon
The dashed lines mark the longest typing pauses, and the longest is labeled at the bottom. By default, pauses are not drawn to scale. To space the snapshots by clock time instead, turn on Display timeline in true time scale in Options.
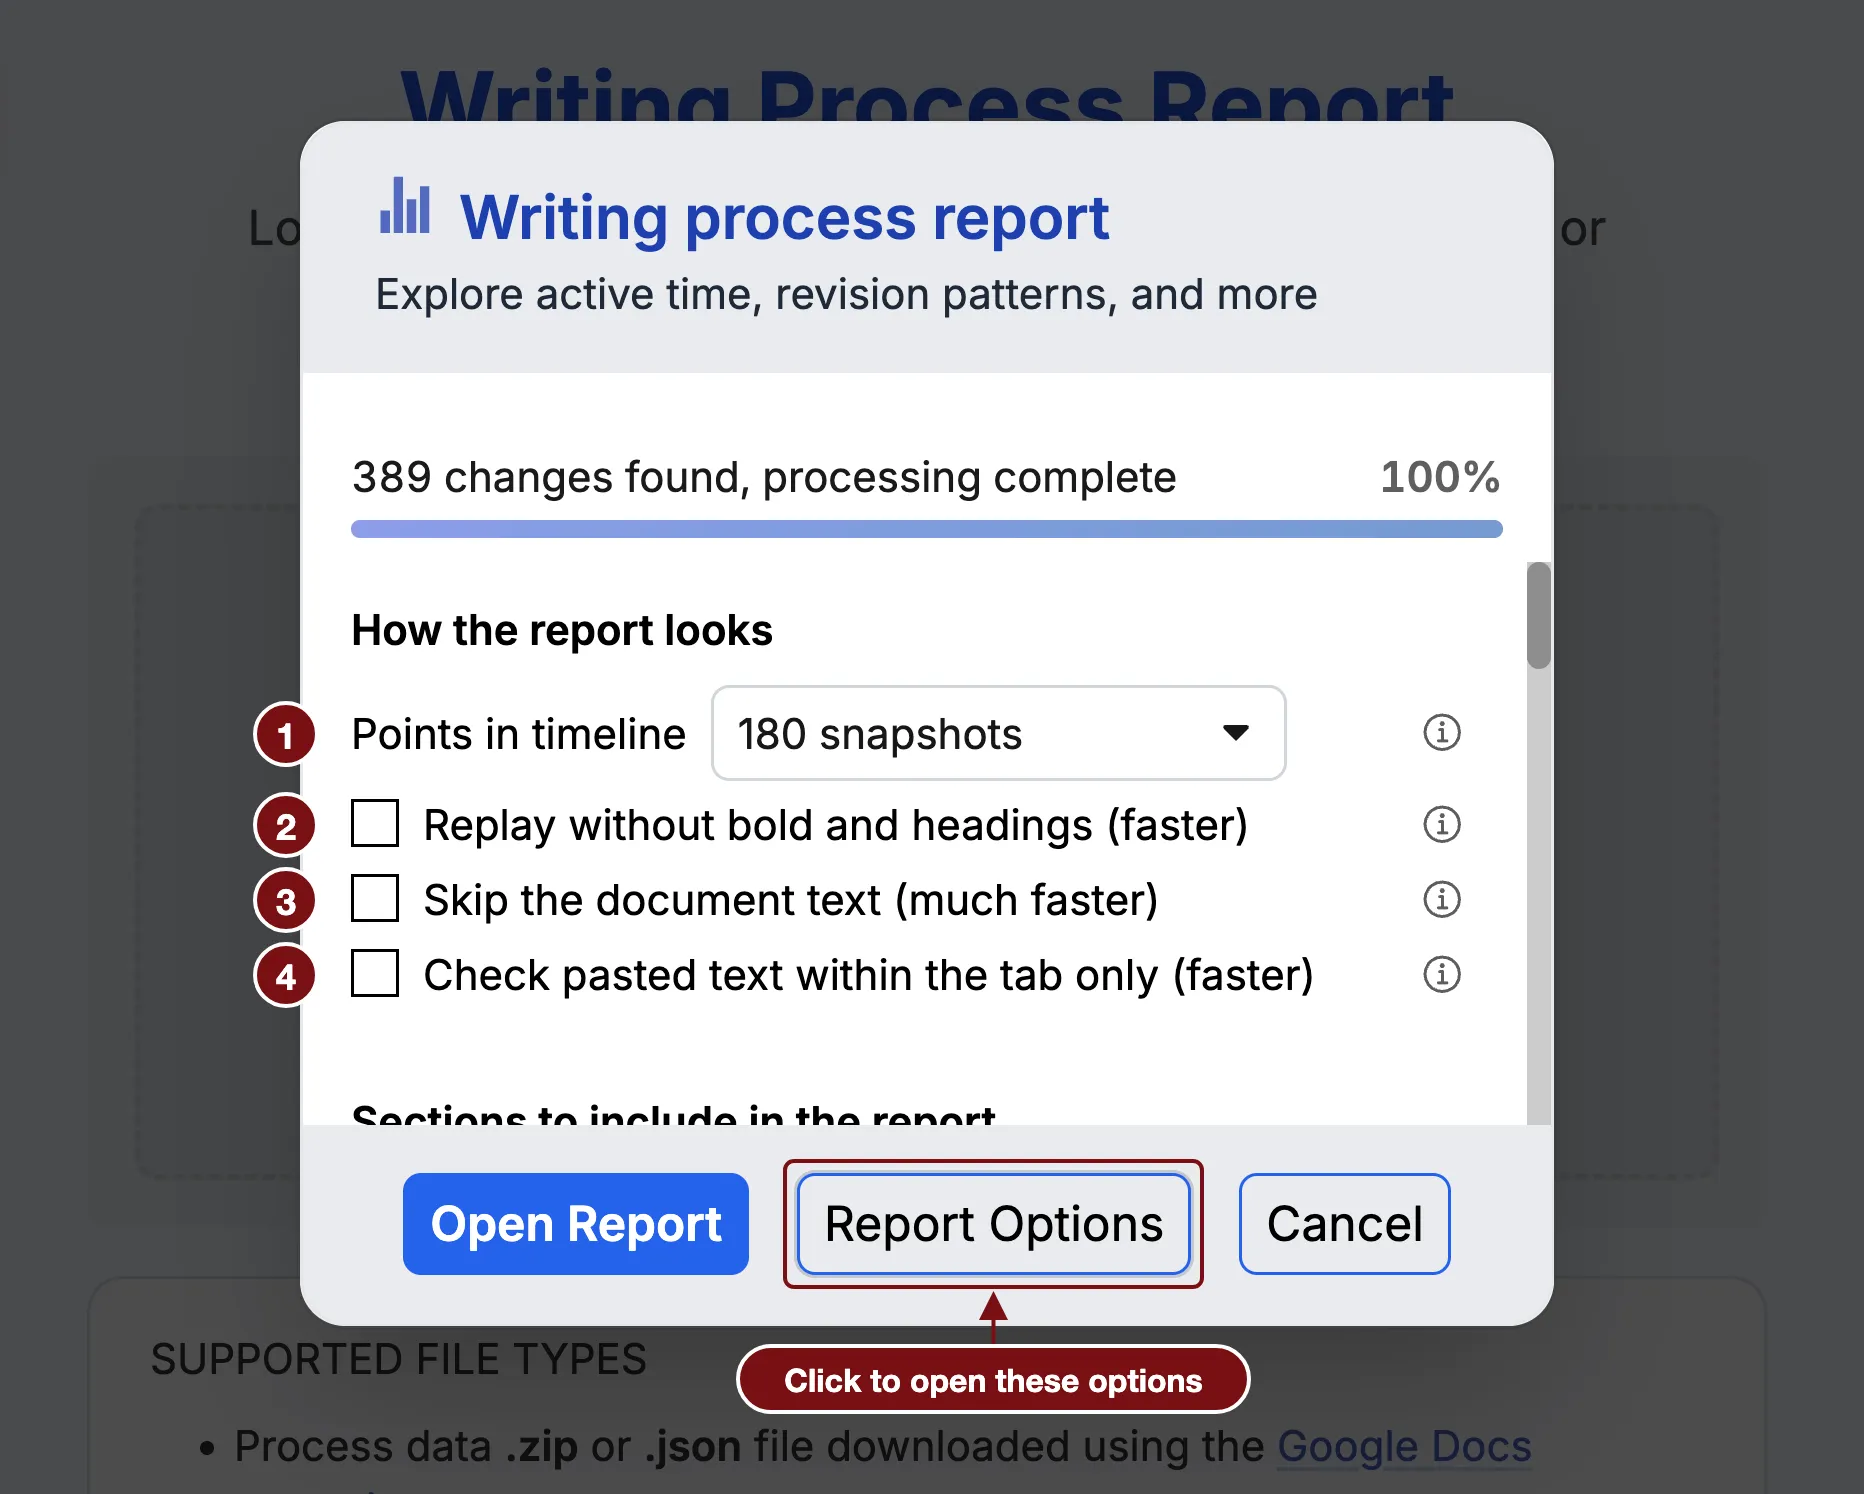
When it appears, the red icon next to the title means the report is not showing every detail. Click it to learn more. To see more, raise Points in timeline in Report Options.
C. Options
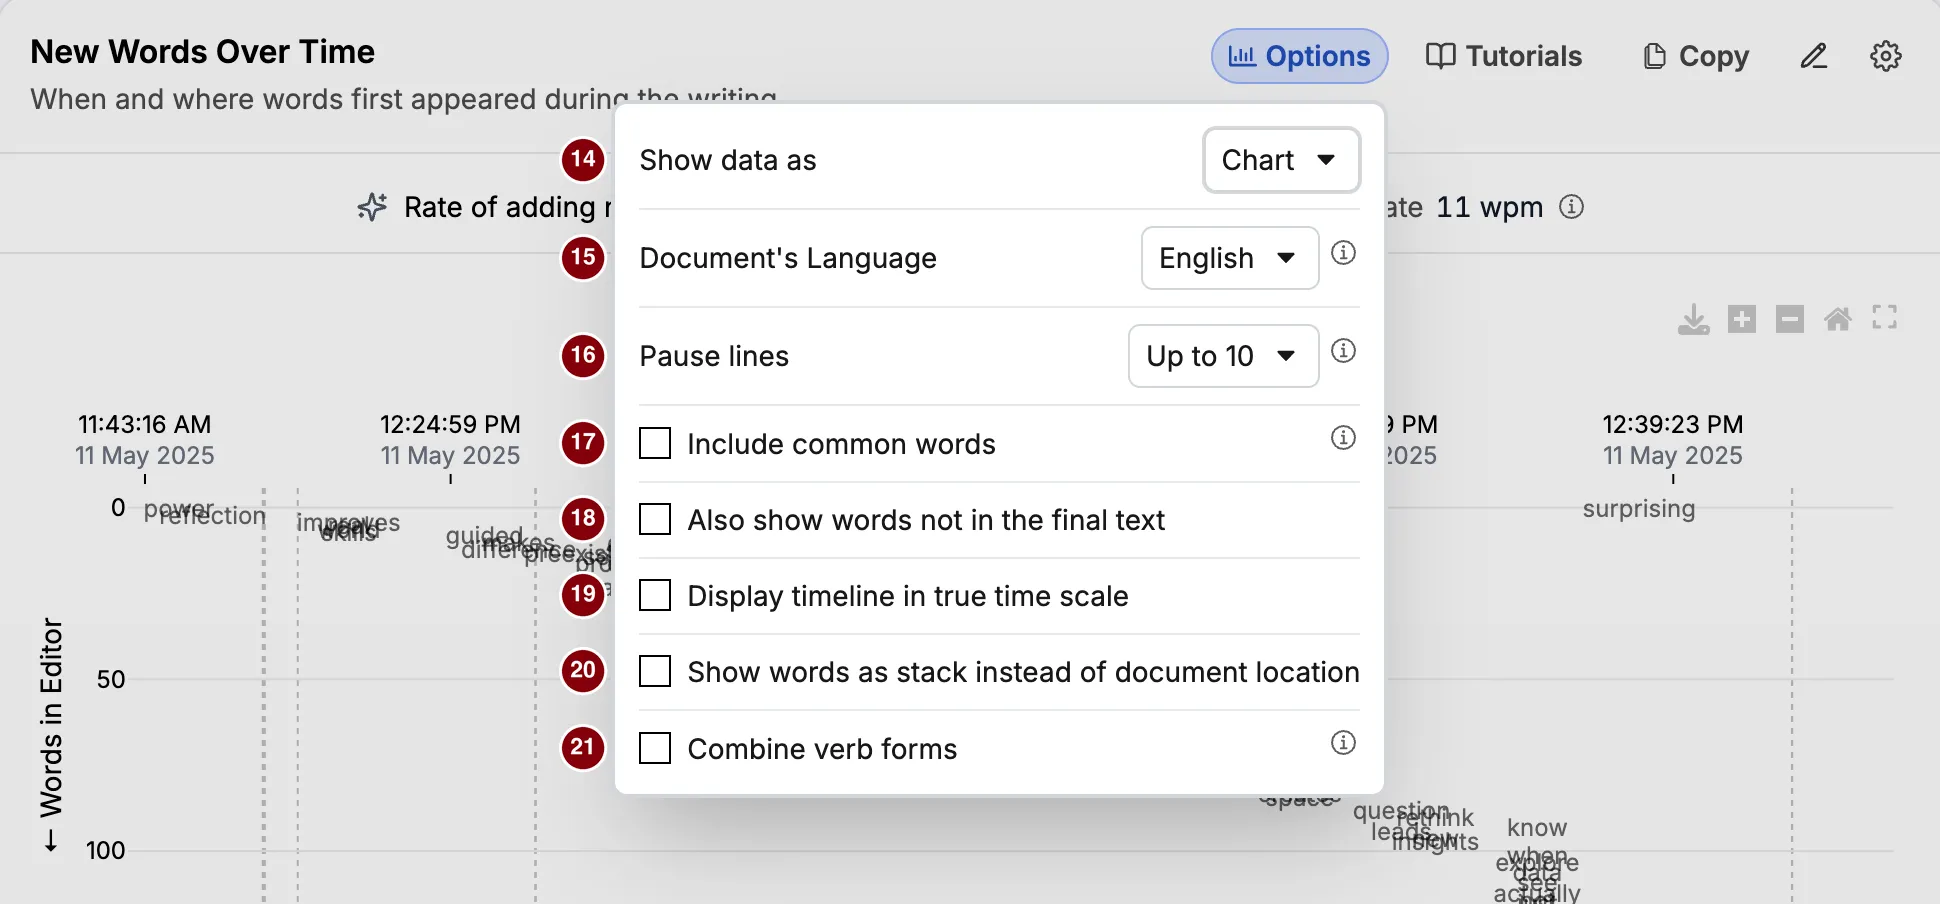
- Show data as switches between Chart, the default, and Table.
- Document’s Language decides which list of common words is left out, and how verb forms are combined. You can choose from 20 languages. The default is English.
- Pause lines sets how many dashed pause lines are drawn: none, up to 10, up to 50, or up to 100. The default is up to 10. It works only in the chart, and not with the true time scale.
- Include common words adds words such as “the”, “and”, and “with”. It is off by default, because these words appear everywhere and crowd the chart.
- Also show words not in the final text adds words that were written and later removed. It is off by default. Turn it on to see what the writer tried and dropped.
- Display timeline in true time scale spaces the snapshots by clock time, so long pauses take up space. It works only in the chart.
- Show words as stack instead of document location (chart only) lists the new words of each snapshot from the top down, in the order they appeared. The side axis then no longer shows where a word is in the document.
- Combine verb forms counts forms of a word as one, such as “running” and “run”. It uses a simple rule, not AI, so it can be wrong: “sentences” can become “sentenc”.
These options also change the numbers in the summary row, because they decide which words count. Pause lines and Display timeline in true time scale are saved in your browser. The other options go back to their defaults each time you open a report.
D. Table view
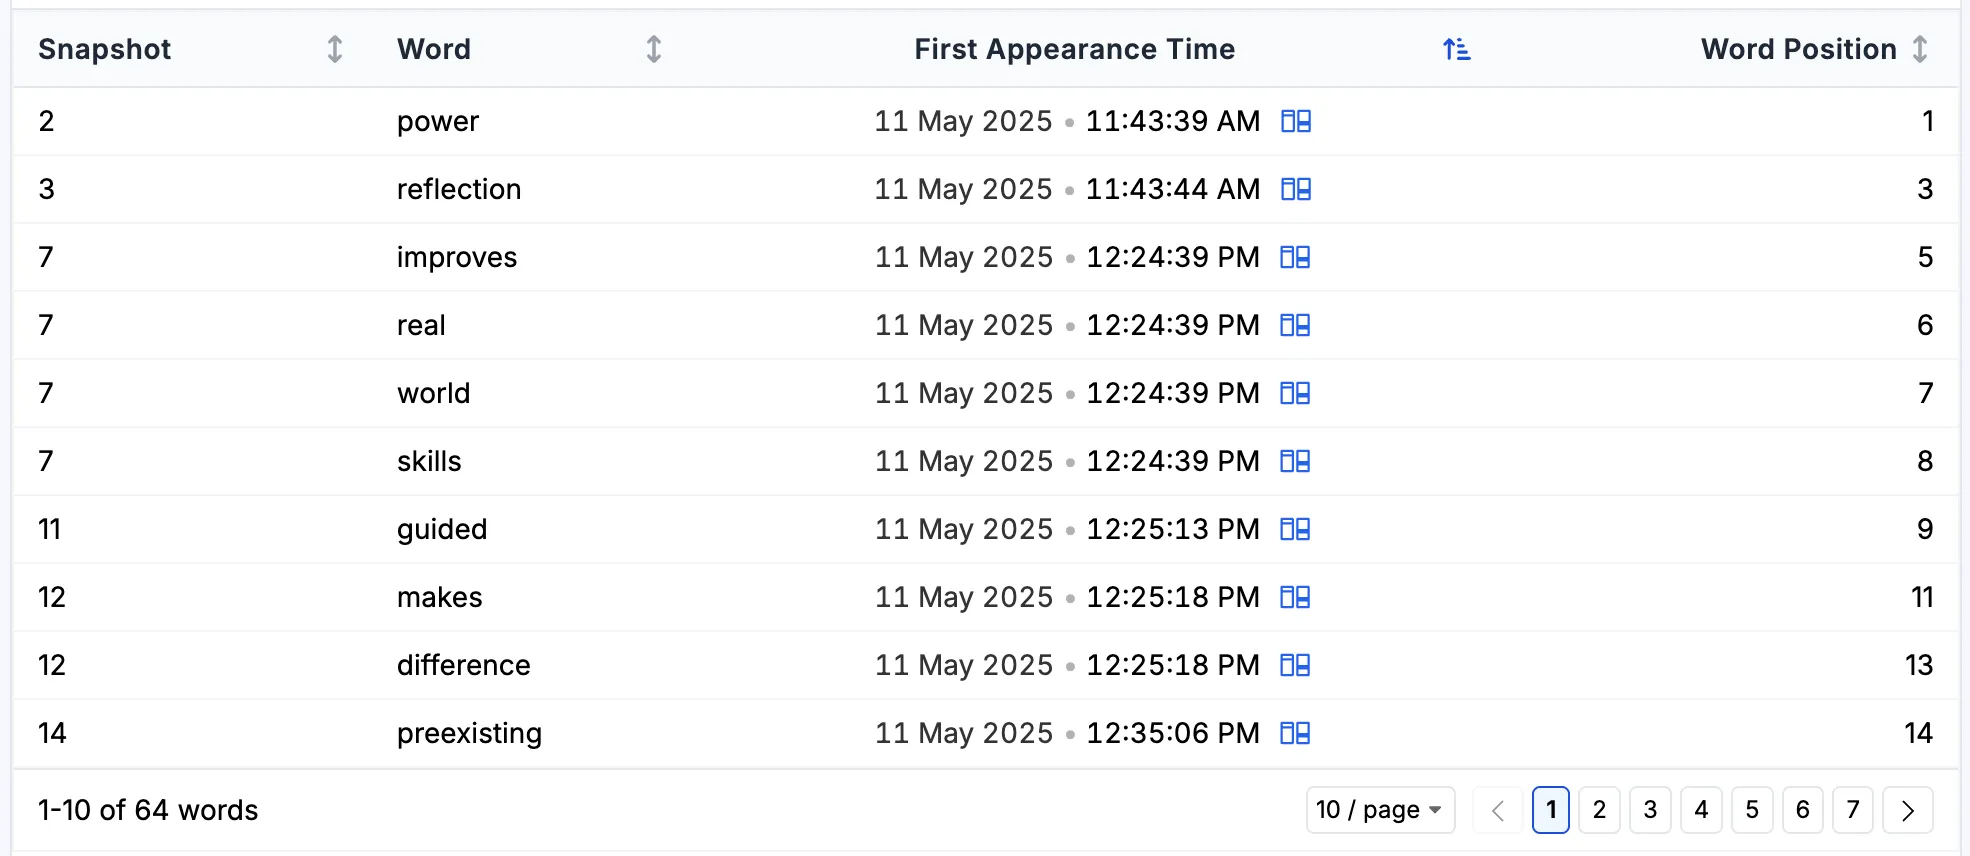
The table has one row for each word.
- Snapshot is the snapshot where the word first appeared.
- Word is the word, in lowercase.
- First Appearance Time is when that snapshot was taken. Click it to jump to Compare Two Snapshots, the same as clicking a word in the chart.
- Word Position is the word’s place in the document at that moment, counted from 0 at the start.
The table is sorted by time, which lists the words in the order they were written. Sort by Word Position to list them in the order they sit in the document. Comparing the two orders is the same thing the chart shows.
In the figure, the word positions skip some numbers. Position 0 is “The” and position 2 is “of”, which are common words and so are not listed.
The table is also the accessible view of this section. Readers who cannot use the chart can explore the same data as rows.
E. What it does not tell you
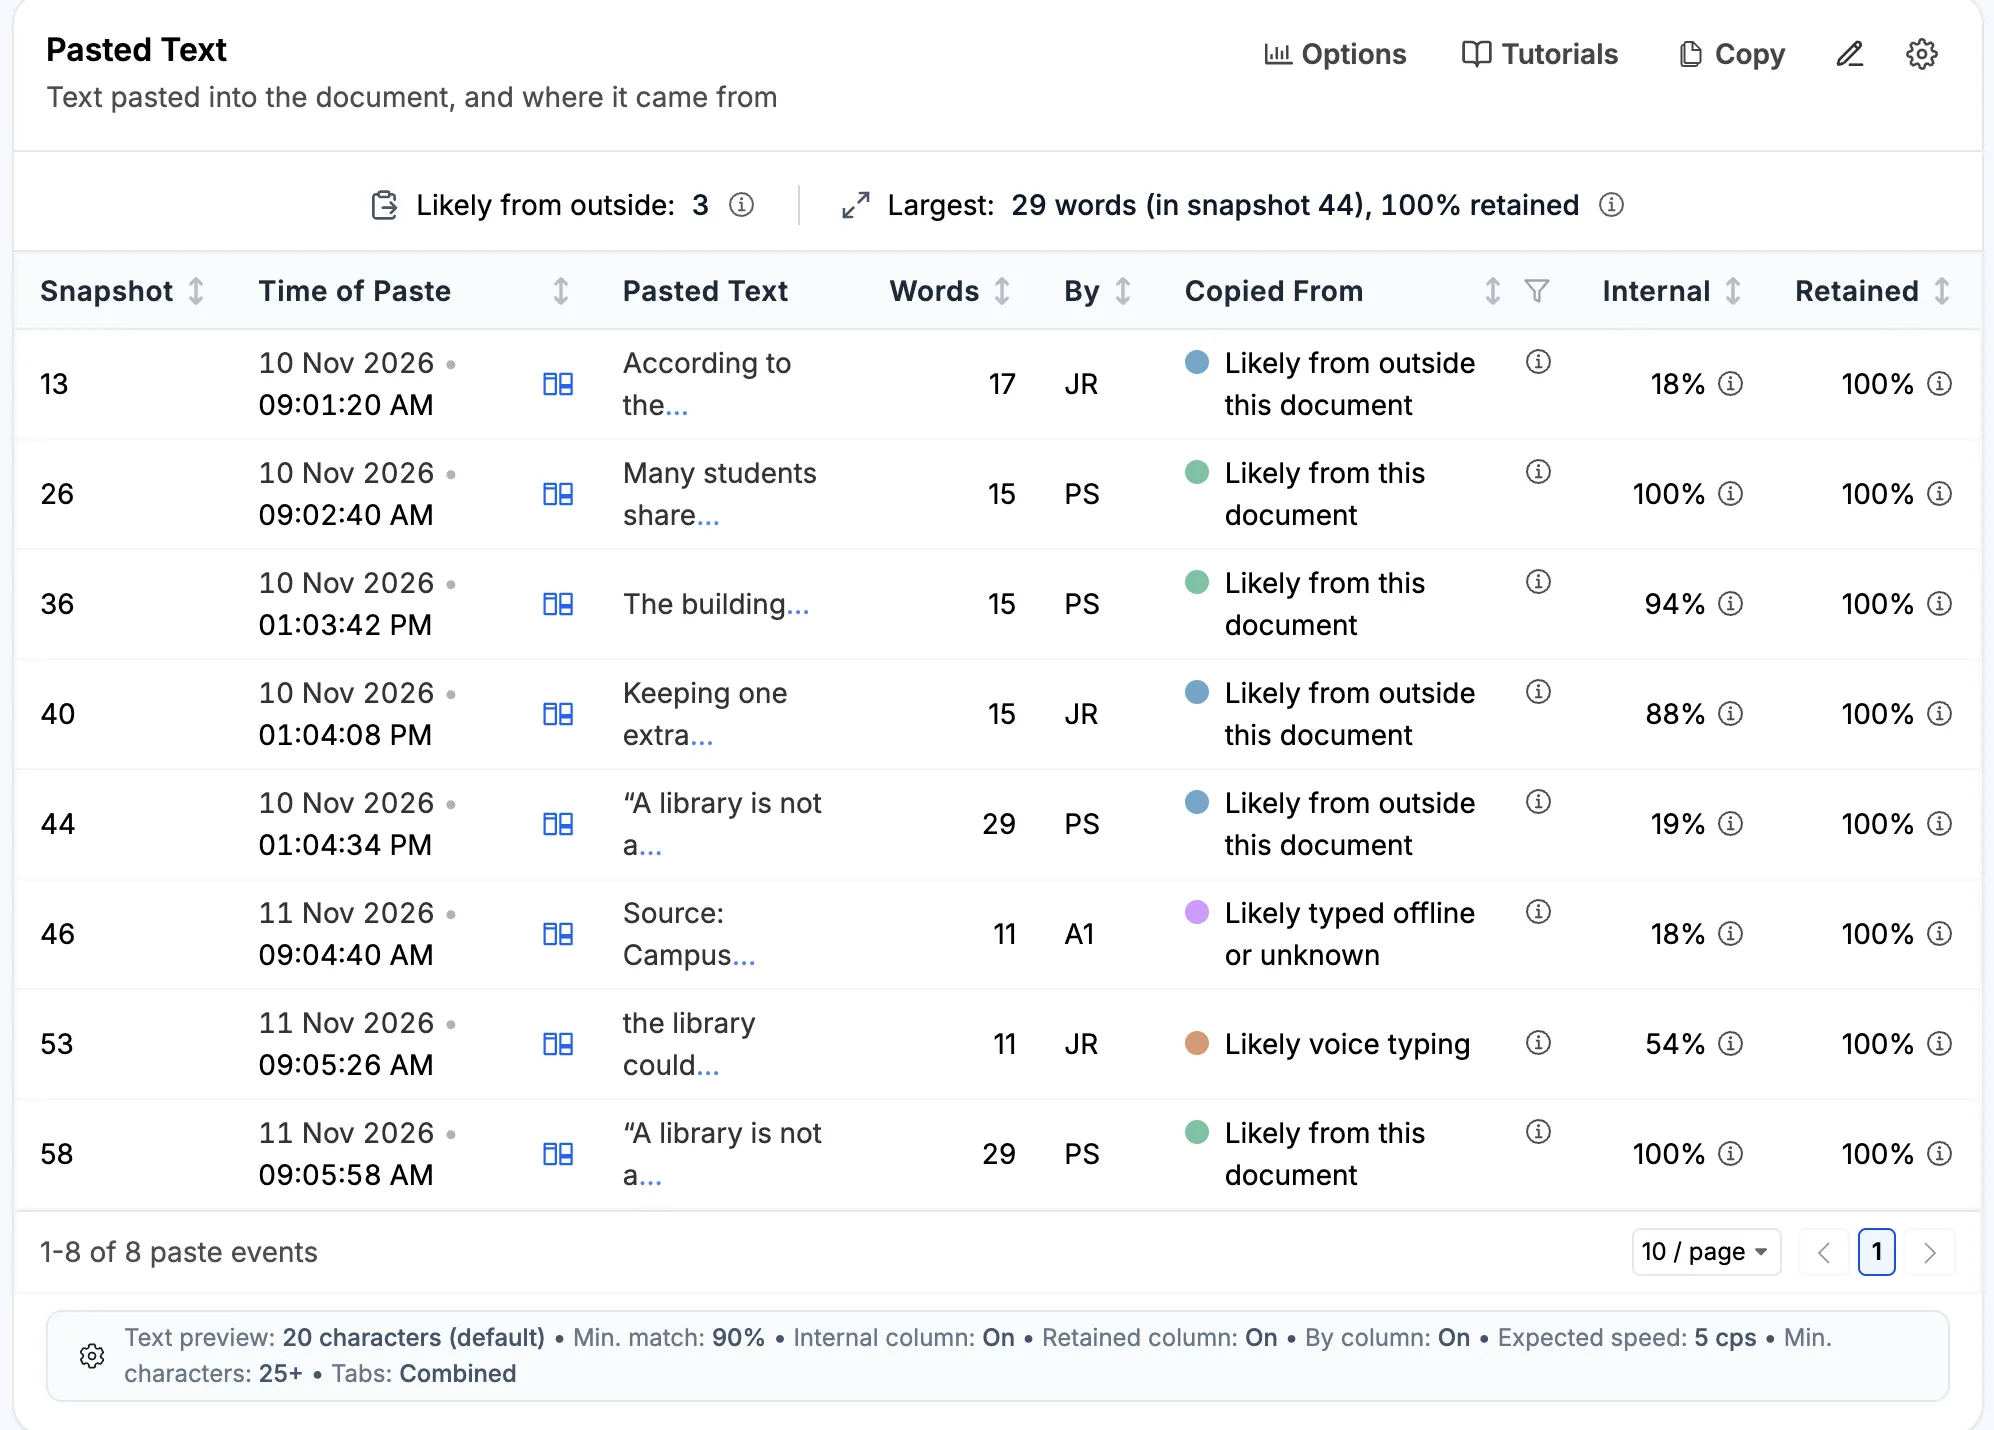
First appearance is not authorship. A word arriving at a given moment does not say where it came from. It may have been typed, pasted, or dictated.
The timing is only as fine as the snapshots. Every word in a snapshot gets the same time, even if they were typed a few seconds apart.
The place is where the word was then, not where it is now. Text added or removed above a word later moves it in the final document, but not on this chart.
F. Using it in class
This section makes the order of thinking visible, which students rarely see.
- Which of your key words were there from the start, and which came late? The words that came late are often the ones the writer only worked out by writing.
- Did you go back and change the opening? Words above the diagonal near the top answer this at a glance.
- Turn on Also show words not in the final text and ask what was cut. Talking about the words a student dropped is a good way into a conversation about revision.