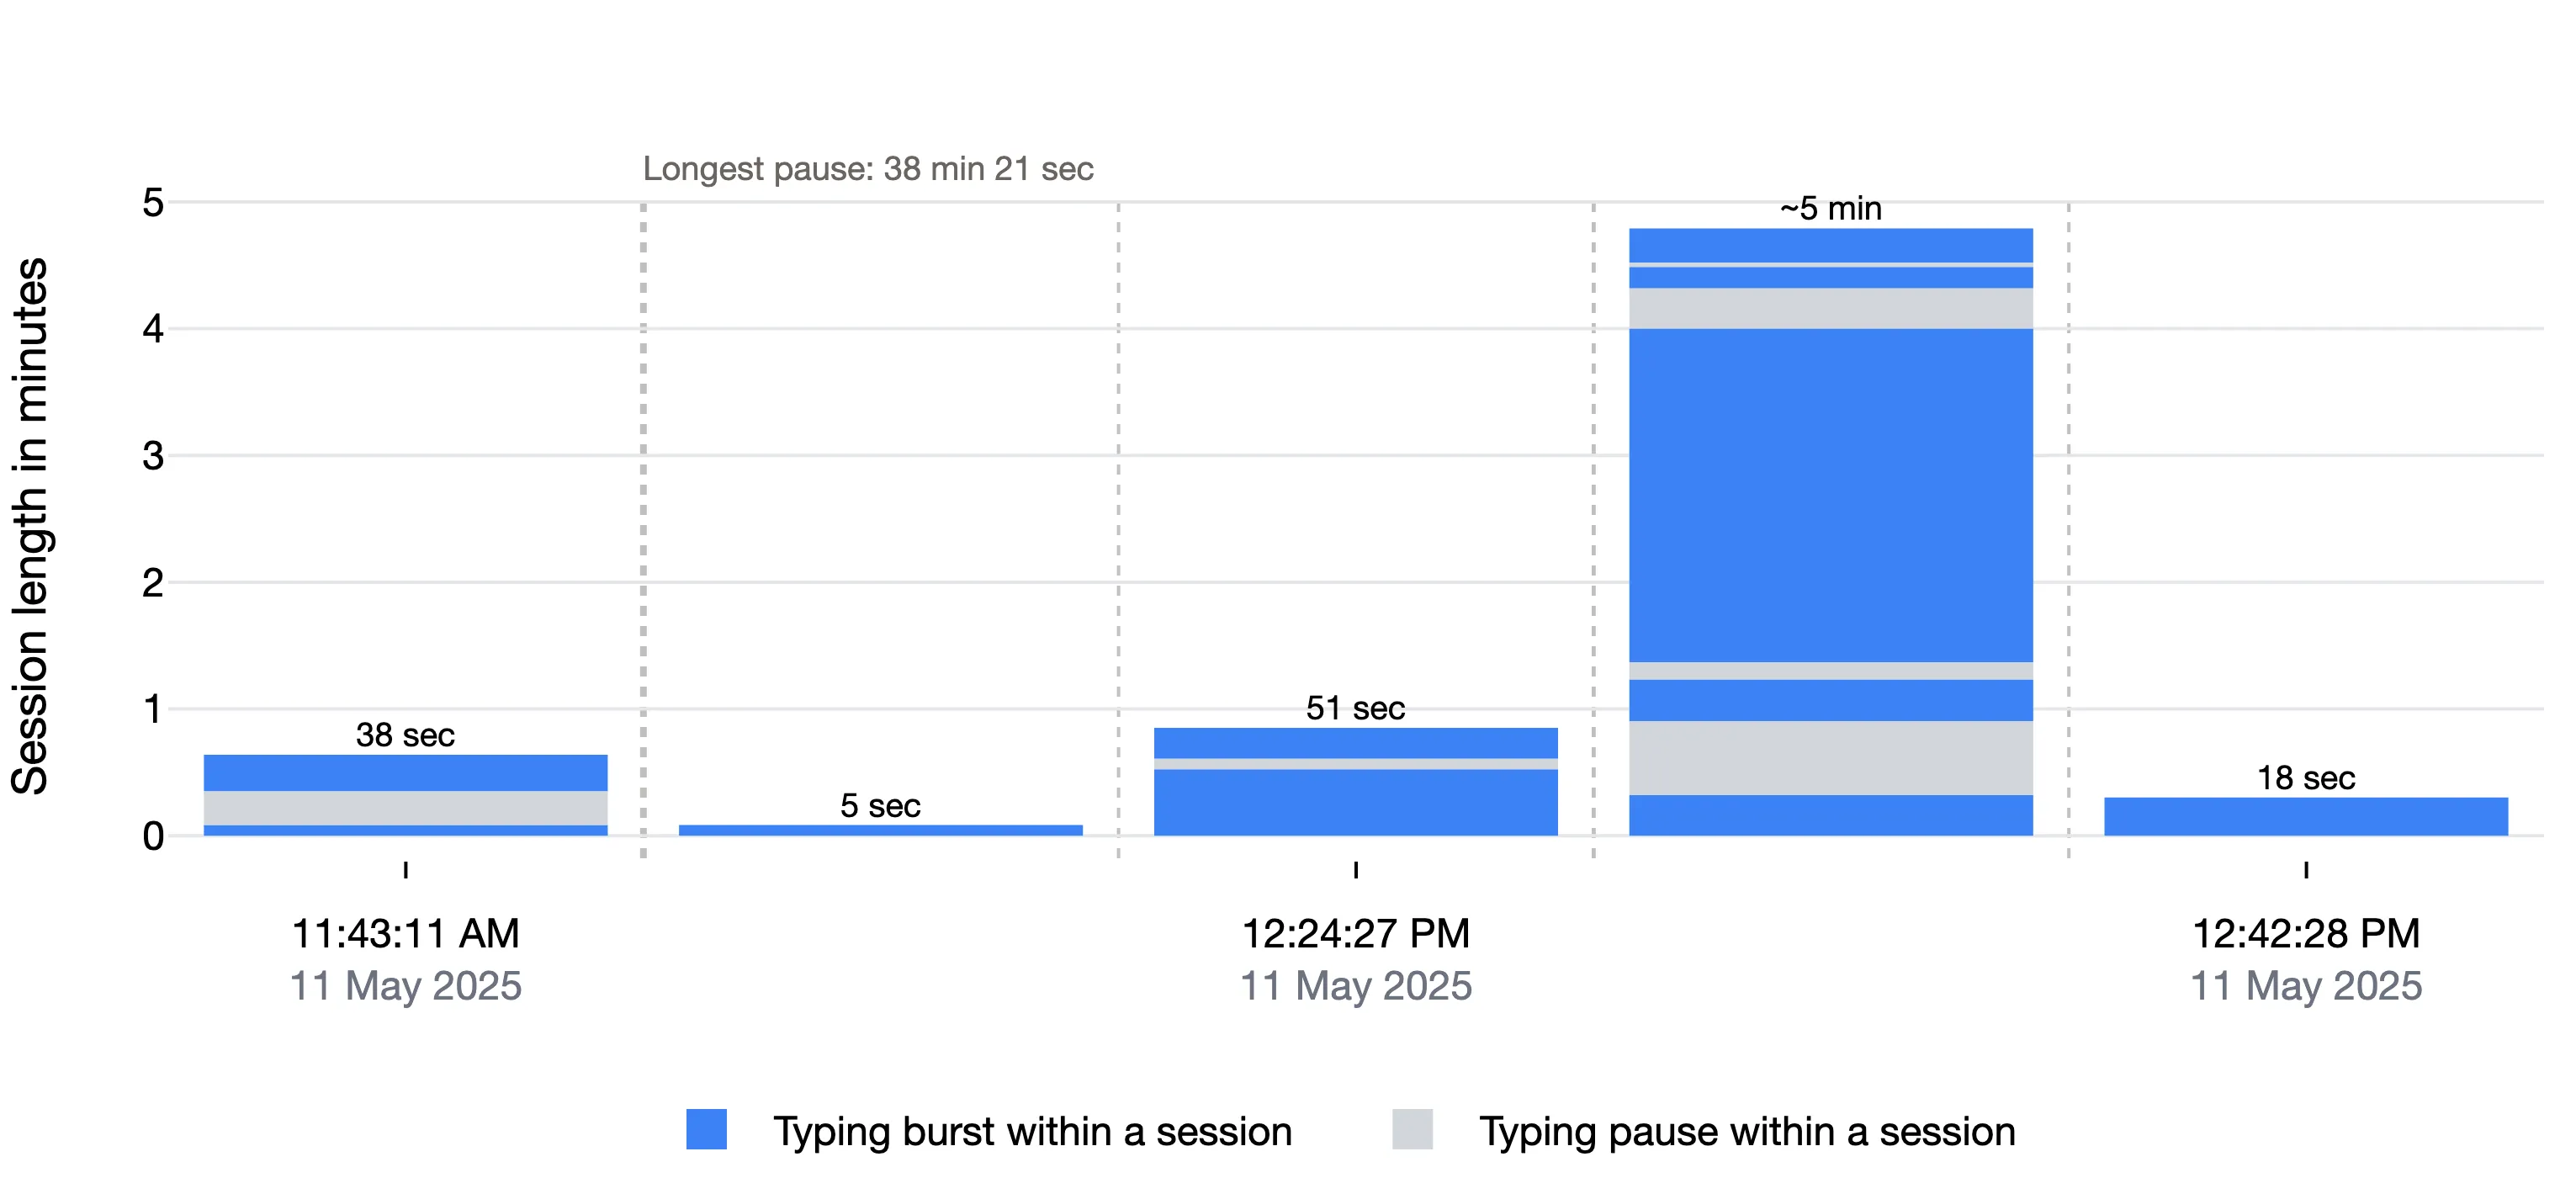
Writing Flow and Pauses shows how the writing was split into sessions. Each bar is one writing session. The dashed lines between the bars are the longer typing pauses that separated one session from the next.
The report says typing pause, not break, on purpose. A student who stops typing may be reading, planning, or working out the next sentence. The report can only see that nothing was typed.
A. How to read the chart
1. One full vertical bar is one writing session
A session is a stretch of writing with no typing pause longer than one minute. You can change this one-minute threshold in Settings, under AFK time for considering inactive. It is the same threshold used for Active Writing Time.
The bars are in time order from left to right. The labels under the bars give the start time and date of a session.
2. Bar height is the length of the session
The y-axis is Session length in minutes, and the number on top of each bar gives the length. In the example, most sessions are under a minute, and one is about 5 minutes.
3. Blue and grey inside a bar
Each bar is made of smaller pieces stacked from the bottom up, in the order they happened.
- Blue is a typing burst within the session.
- Grey is a typing pause within the session. Each grey piece is shorter than the threshold, so it still counts as part of the session.
In each writing session (complete vertical bar), you may see two patterns: steady writing and bursty writing.
| Steady writing session | Bursty writing session | |
|---|---|---|
| How the bar looks | 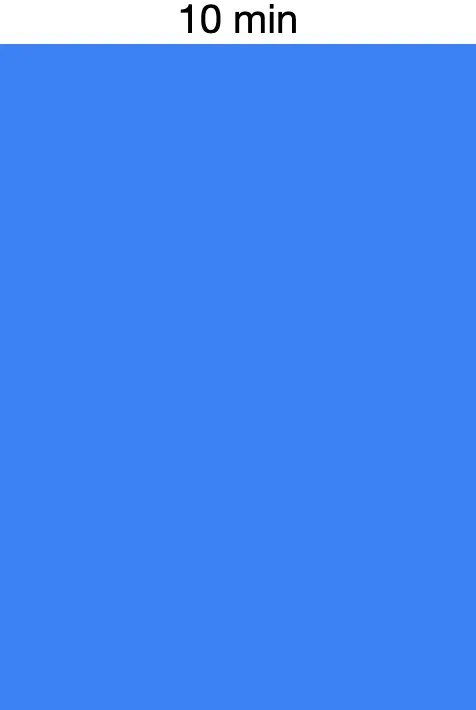 Solid blue from top to bottom, or close to it | 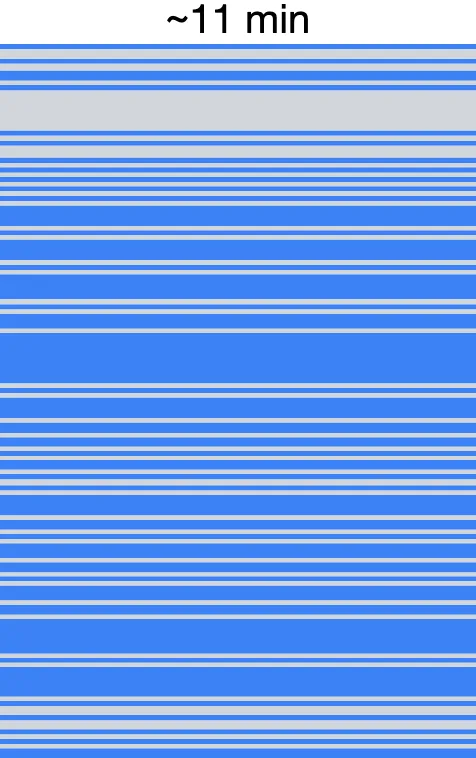 Striped with many thin grey pieces |
| What the writer did | Typed intensely for minutes at a time without stopping. | Typed in short bursts and stopped often, for a few seconds at a time. |
| Examples of when it happens | 1) Writing during an exam 2) Power free writing 3) Transcribing an essay that is already written | 1) Revising a draft 2) Working on something that takes a lot of thought |
Many bars are somewhere in between. The examples below show both patterns in real reports.
4. Dashed lines are the long pauses
Every dashed line between two bars is a typing pause longer than the threshold. The chart does not draw these pauses to scale. A 2-minute pause and a 2-day pause both look like one dashed line.
The thickest dashed line is the longest pause, and its length is written above it. In the example, the longest pause is 38 min 21 sec, between the first and second sessions.
B. Annotated figure
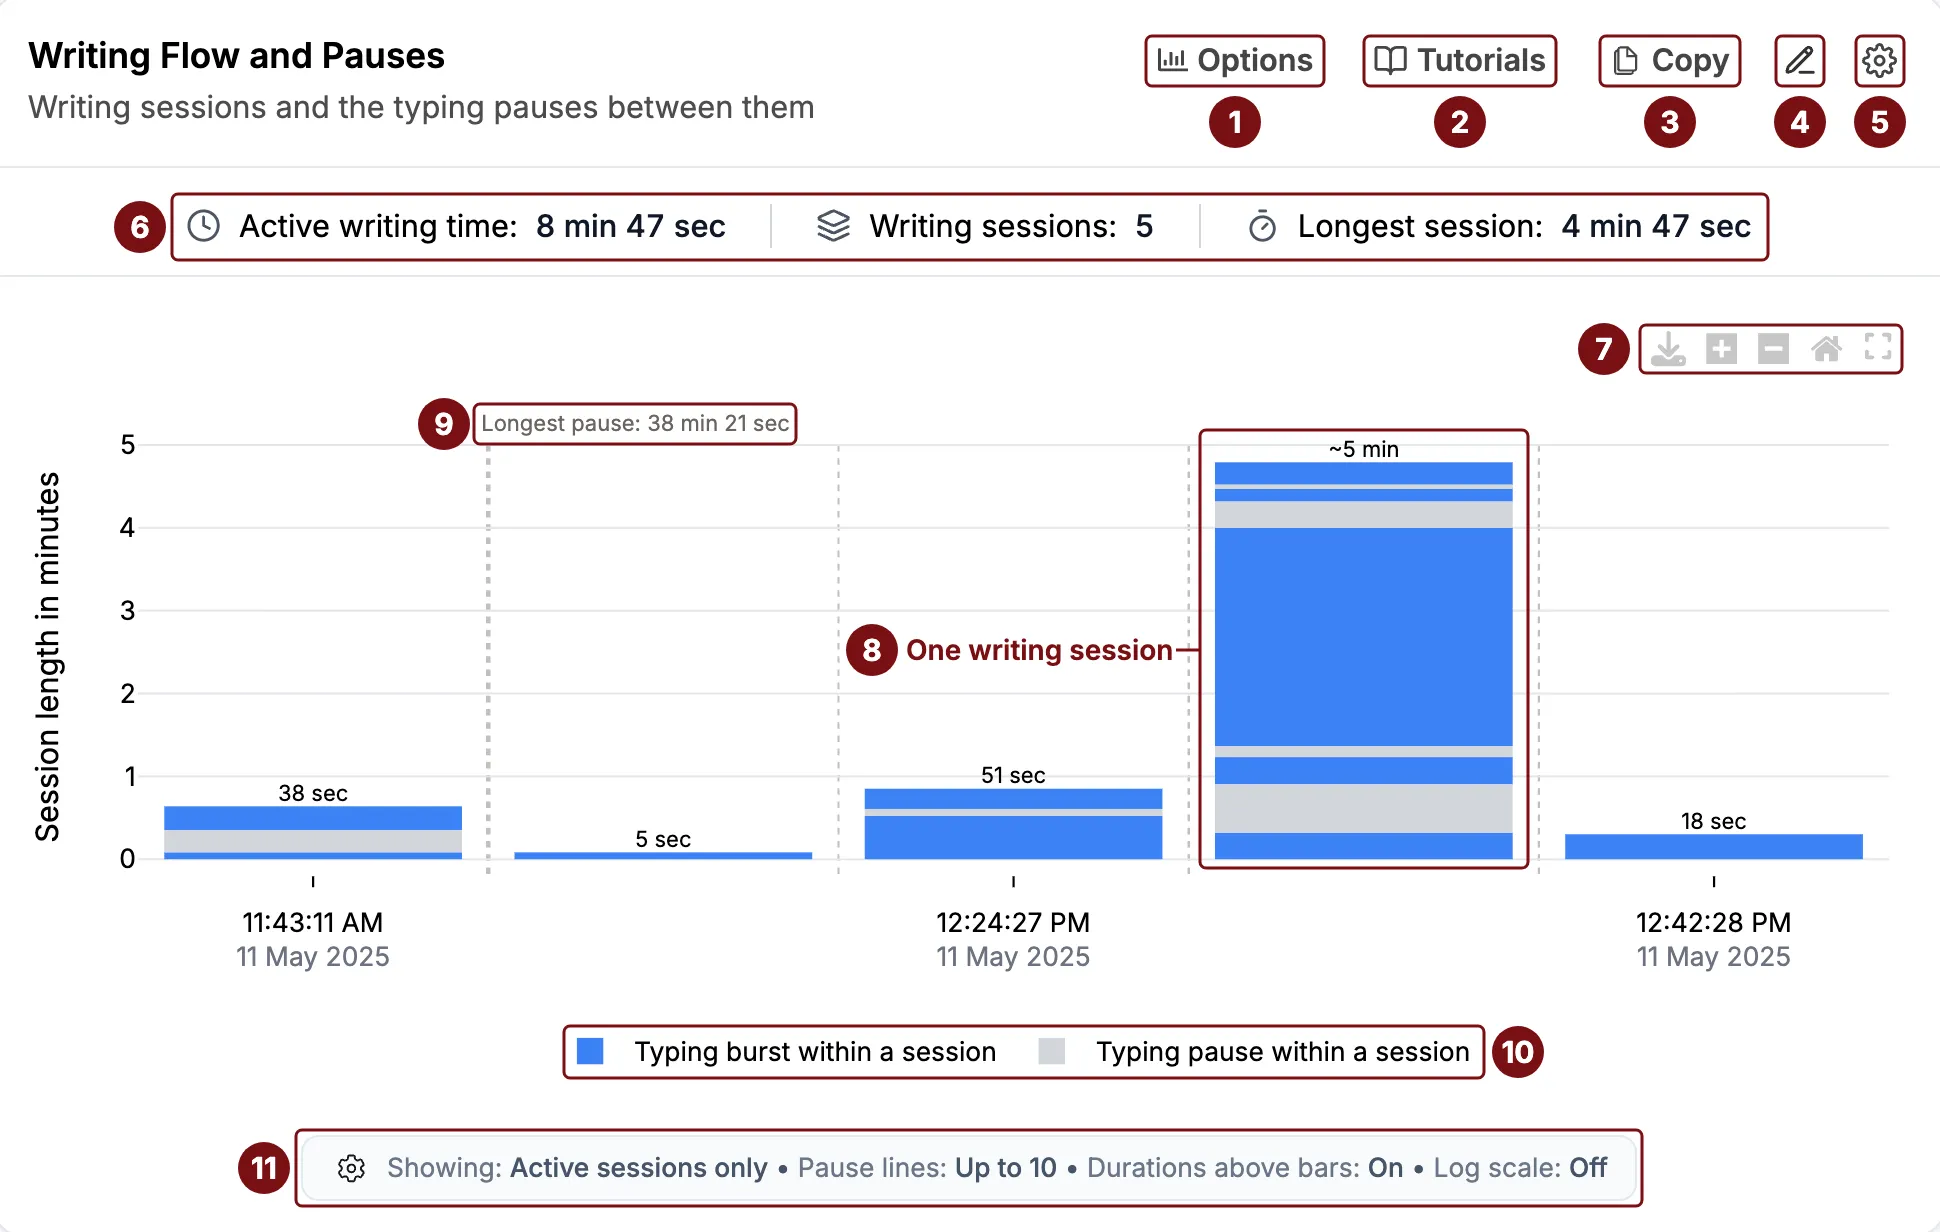
- Options opens the chart settings described below.
- Tutorials opens this help page.
- Copy copies this section.
- Add note lets you write a comment on this section that travels with the report.
- Layout options let you collapse the section or move it up or down in the report.
- The summary row shows the total active writing time, the number of writing sessions, and the length of the longest session.
- The chart toolbar lets you download the chart as an image, zoom in and out, reset the view, and go fullscreen.
- One writing session. Each bar is one session. Its height is the session length, and the number on top gives it. Blue parts are typing bursts and grey parts are short typing pauses inside the session.
- The longest pause is labeled. Dashed vertical lines mark the typing pauses between sessions.
- The legend names each color.
- The status bar shows the current settings without opening Options.
C. Table view
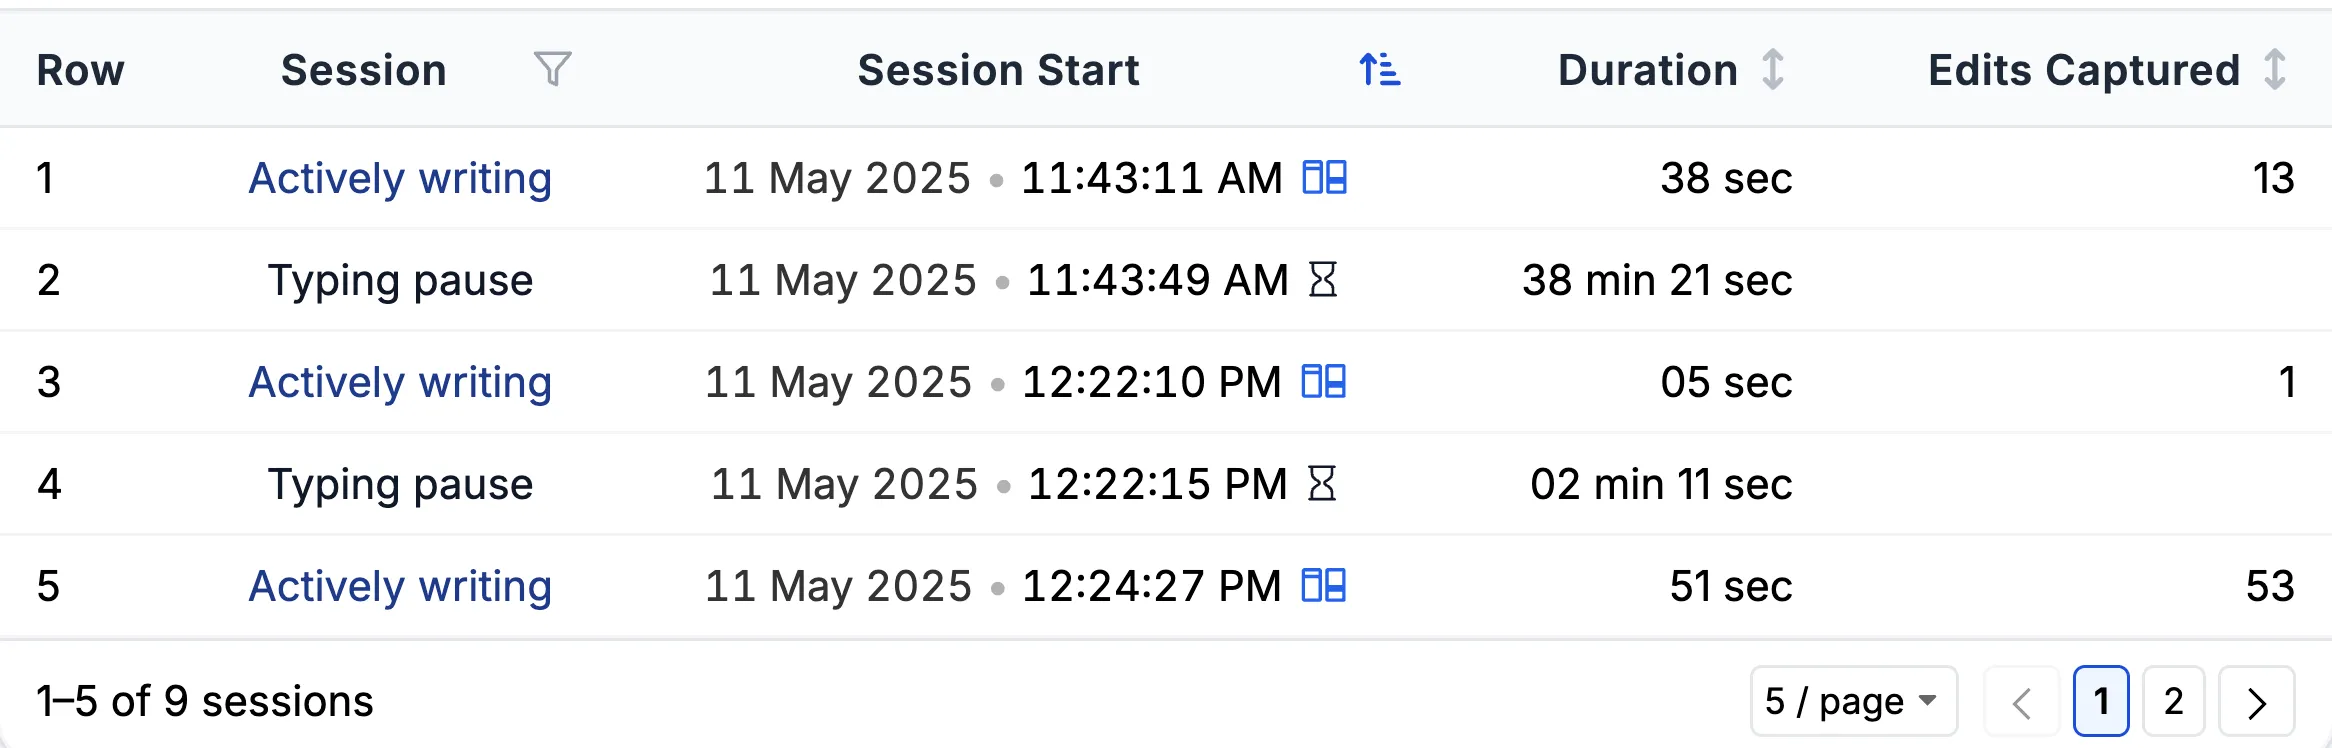
The table lists the writing sessions and the long typing pauses between them, one per row, in time order.
- Session is either Actively writing or Typing pause. The filter icon in the header lets you show only one kind.
- Session Start gives the date and time. A writing session has a compare icon next to it, and a typing pause has an hourglass.
- Duration is the length of the session or pause.
- Edits Captured is the number of recorded changes in a writing session. It is empty for pauses.
Session Start, Duration, and Edits Captured can be sorted. Sorting by Duration is a quick way to find the longest pauses. The footer shows how many rows there are, and you can choose how many to show per page.
D. Options
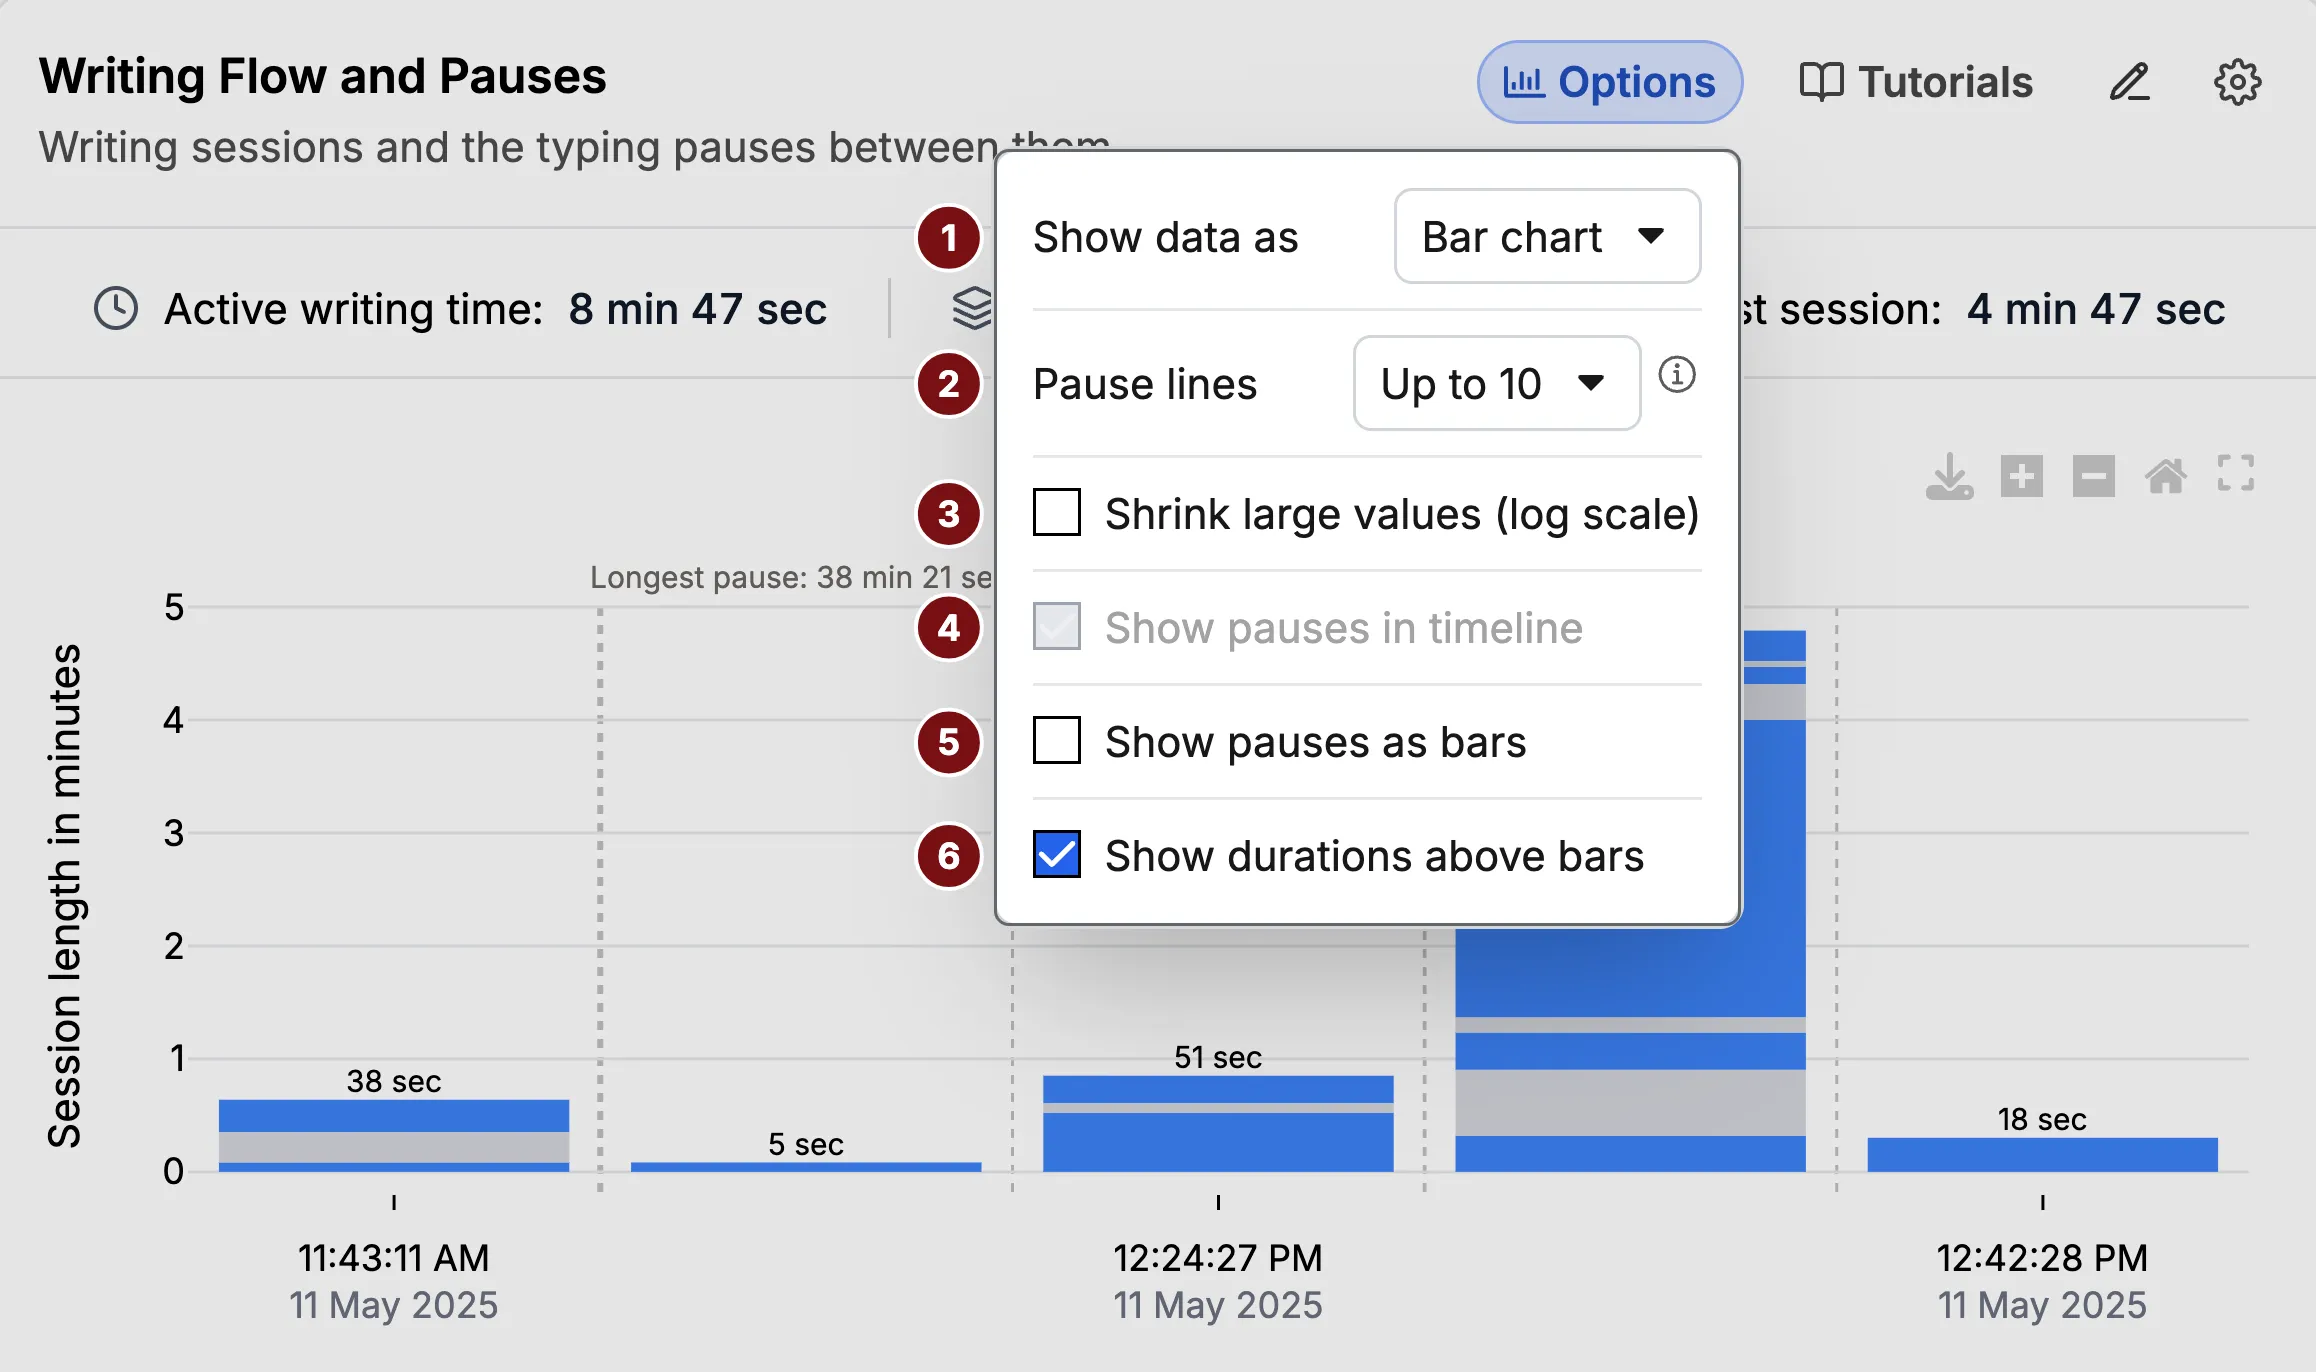
- Show data as switches between the bar chart and the table.
- Pause lines limits how many dashed pause lines are drawn between sessions. The longest pauses are drawn first.
- Shrink large values (log scale) compresses the y-axis. This helps when one long session makes the others too short to read. With it on, bar heights rank the sessions but no longer measure them.
- Show pauses in timeline includes the long typing pauses in the timeline. It is grayed out when it does not apply to the current view.
- Show pauses as bars draws each long typing pause as its own bar, so you can compare pauses with sessions.
- Show durations above bars writes the length of each session on top of its bar. It is on by default.
None of these options change the numbers in the summary row. Only the chart changes.
E. What counts and what is excluded
Counted: recorded typing in this document, split into sessions at every typing pause longer than the threshold.
Excluded: what the writer was doing during a pause, and work in any other file or app.
F. What it does not tell you
A typing pause is not idle time. Reading sources, thinking, outlining on paper, and being away from the desk all look the same here.
The threshold is a setting, not a fact about the writer. Two sessions split by a pause just over one minute may really be one piece of work.
Long pauses are not to scale. Check the longest pause label, or the table, to see how long the gaps really were.
For the total time spent typing as a single number, see Active Writing Time. For how much text each session produced, see Characters Added and Removed. A long session that produced very little text is different from one that produced a page.
G. Example student reports
These examples use the two patterns described in Blue and grey inside a bar: steady writing and bursty writing.
1. Steady writing in one sitting
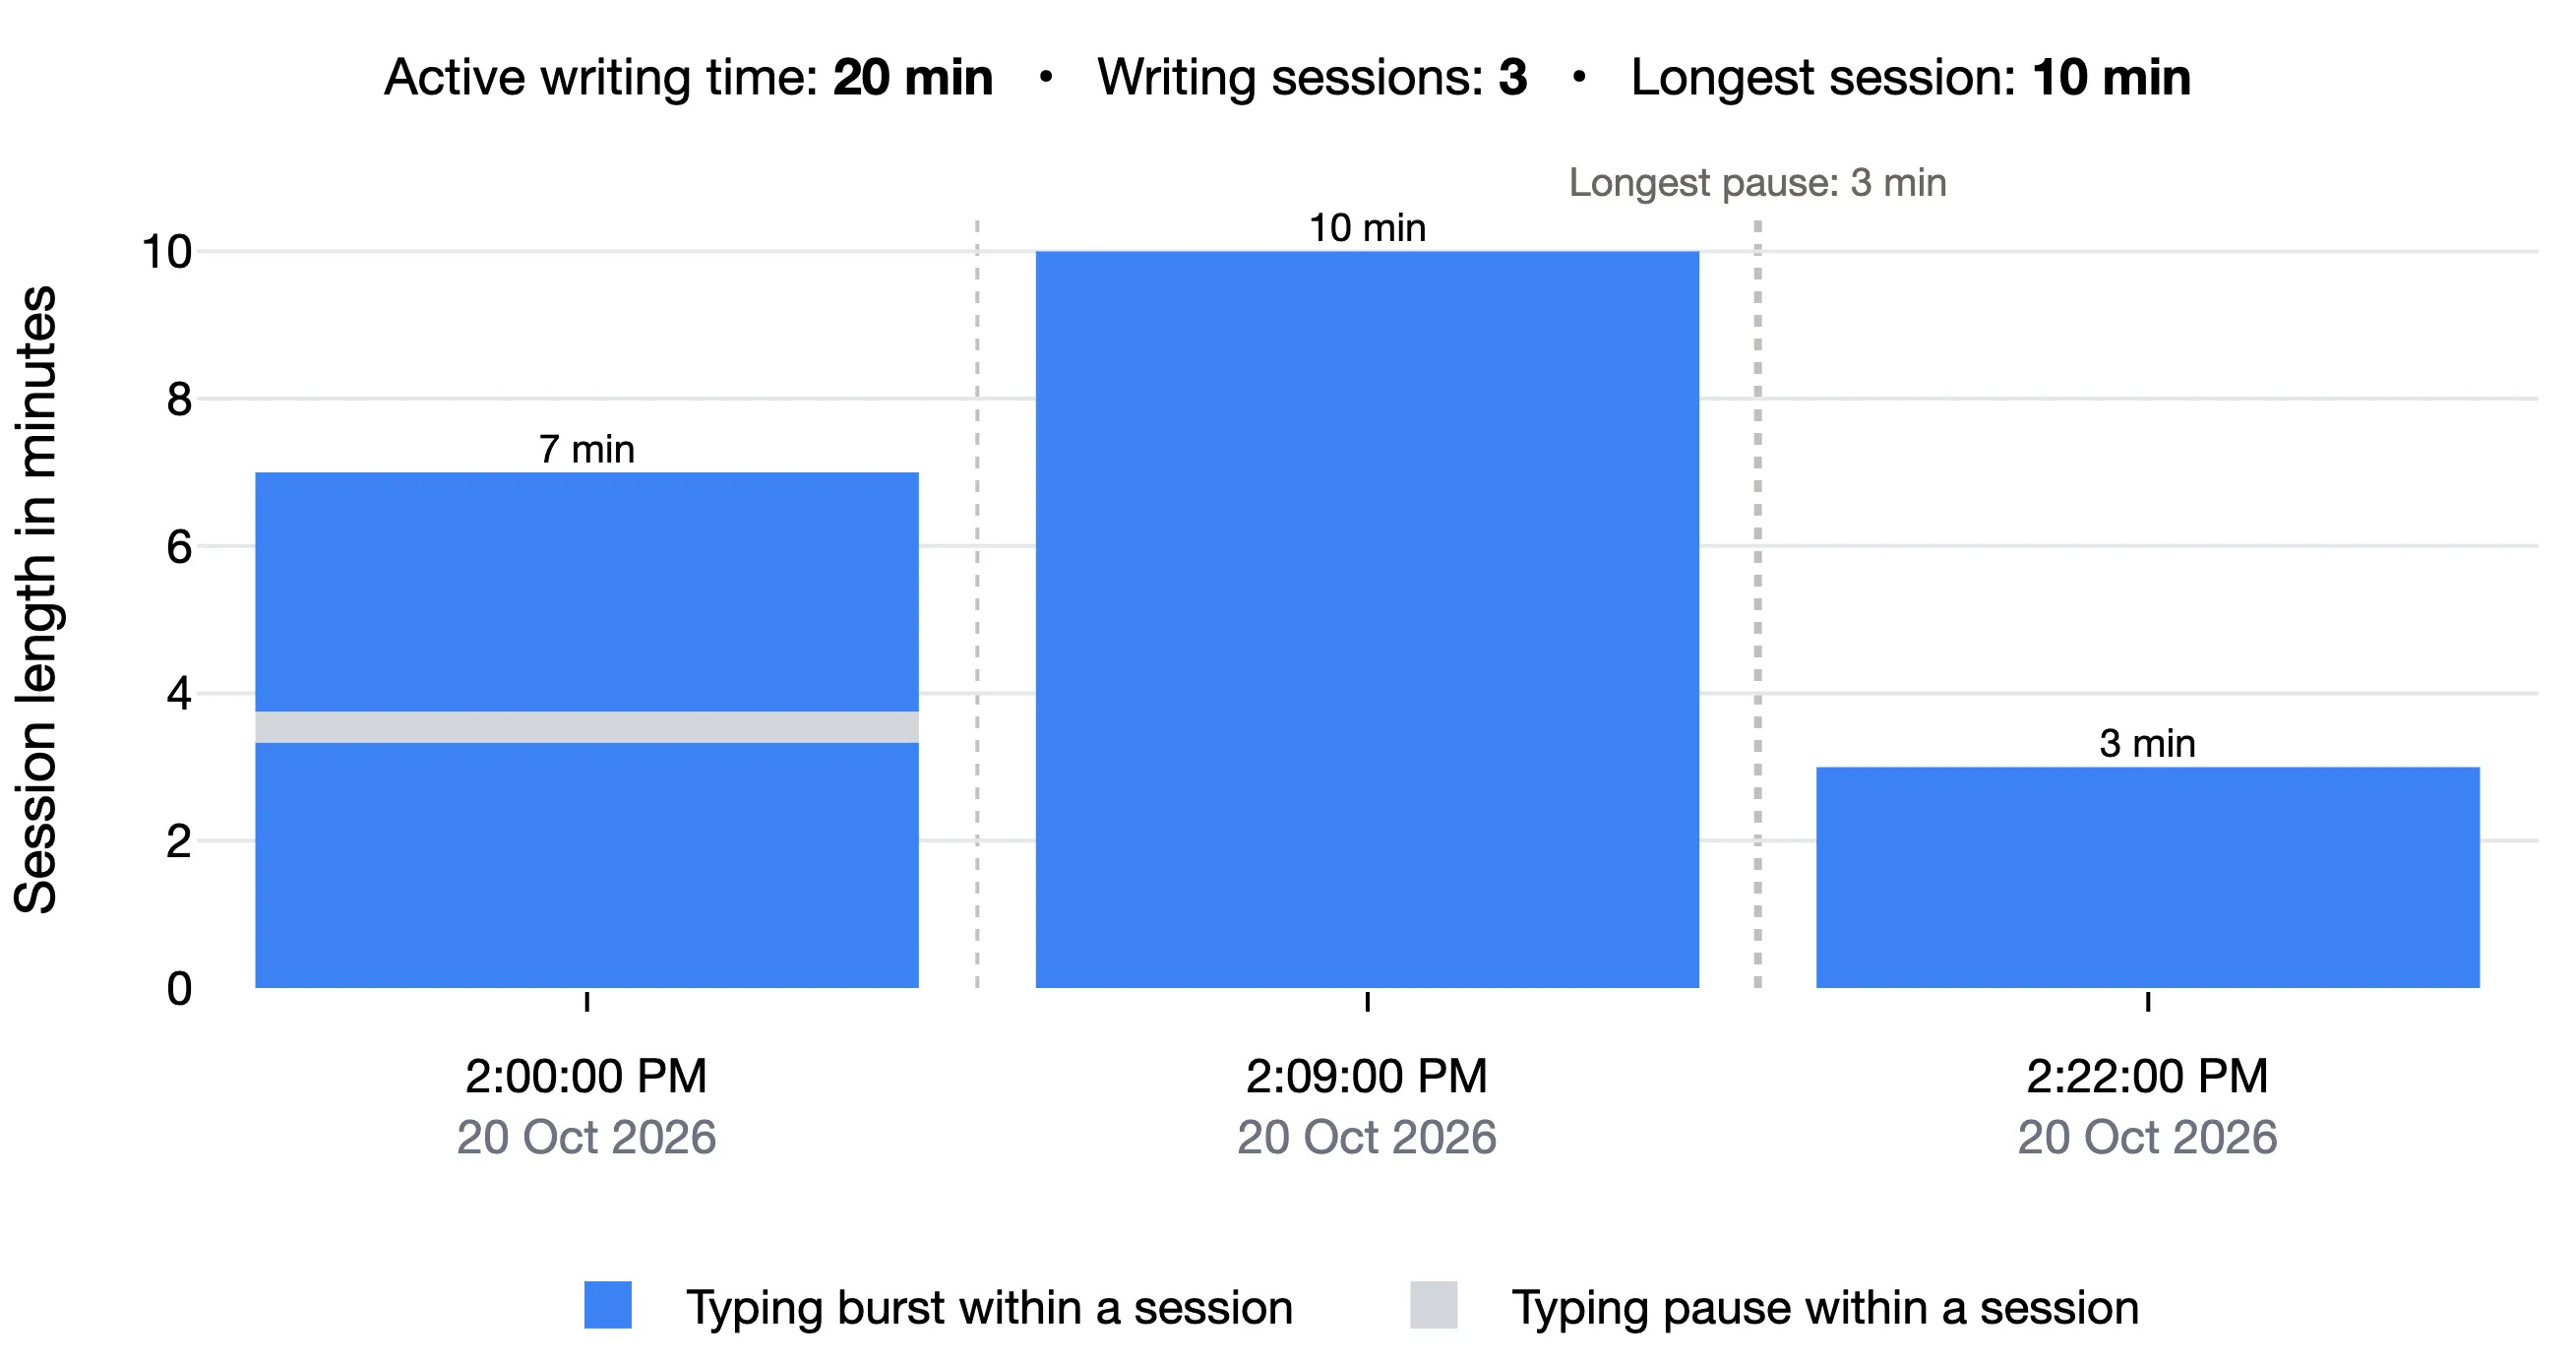
Three sessions in one afternoon, 25 minutes from start to finish. The bars are almost solid blue. The first session has one short stop. The second is 10 minutes of typing without a single stop of even a few seconds.
This is steady writing at its most extreme. Typing this long without stopping is unusual when someone is composing. It can mean a fast, confident writer. It can also mean the writer was typing from notes, a paper draft, or another source. Check Writing Pace and Copy-Paste Activity before drawing a conclusion.
2. Bursty writing: thinking between short bursts
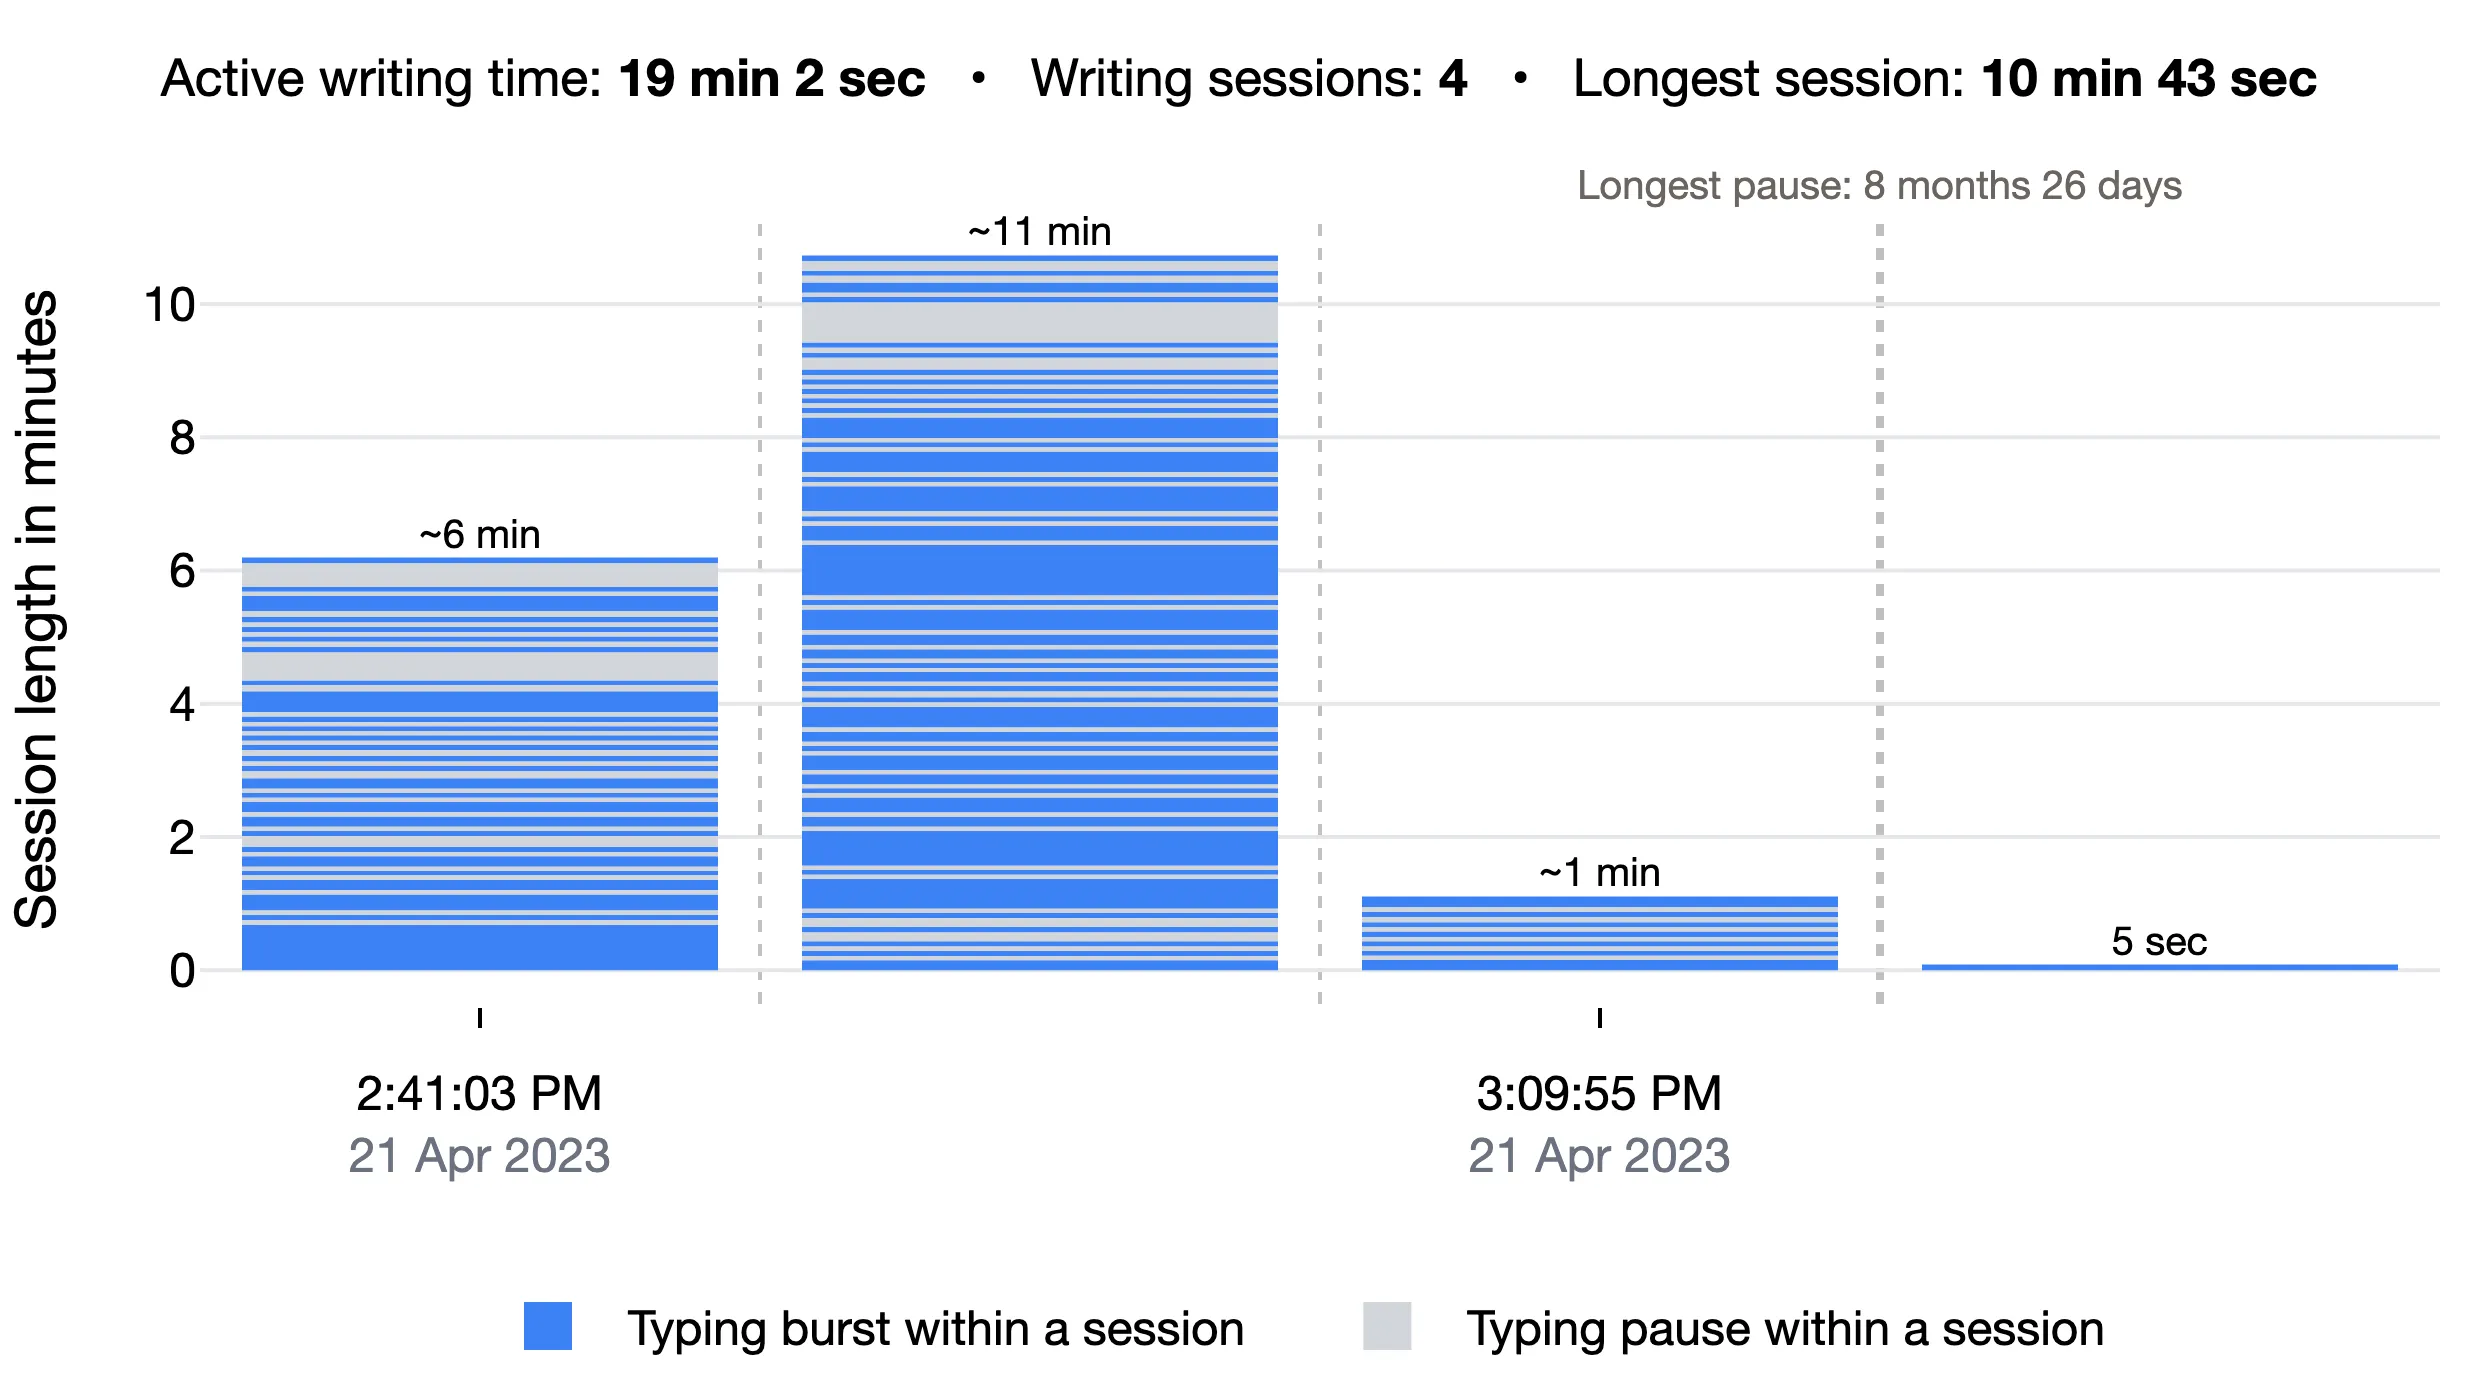
Every bar is striped from top to bottom with thin blue and grey pieces. More than a third of each session is short stops. The writer typed a few words, stopped for a few seconds, typed again, and kept going like that the whole time.
This is bursty writing. Each stop is short, but there are many of them. They are often where the thinking happens: the writer works out the next phrase, rereads, or changes their mind before typing. Pauses like these are typical of a writer composing their own ideas.
The last bar is a single 5 sec session, more than 8 months later. Someone opened the document and made one small change long after the writing was done.
3. Steady sessions first, then bursty sessions
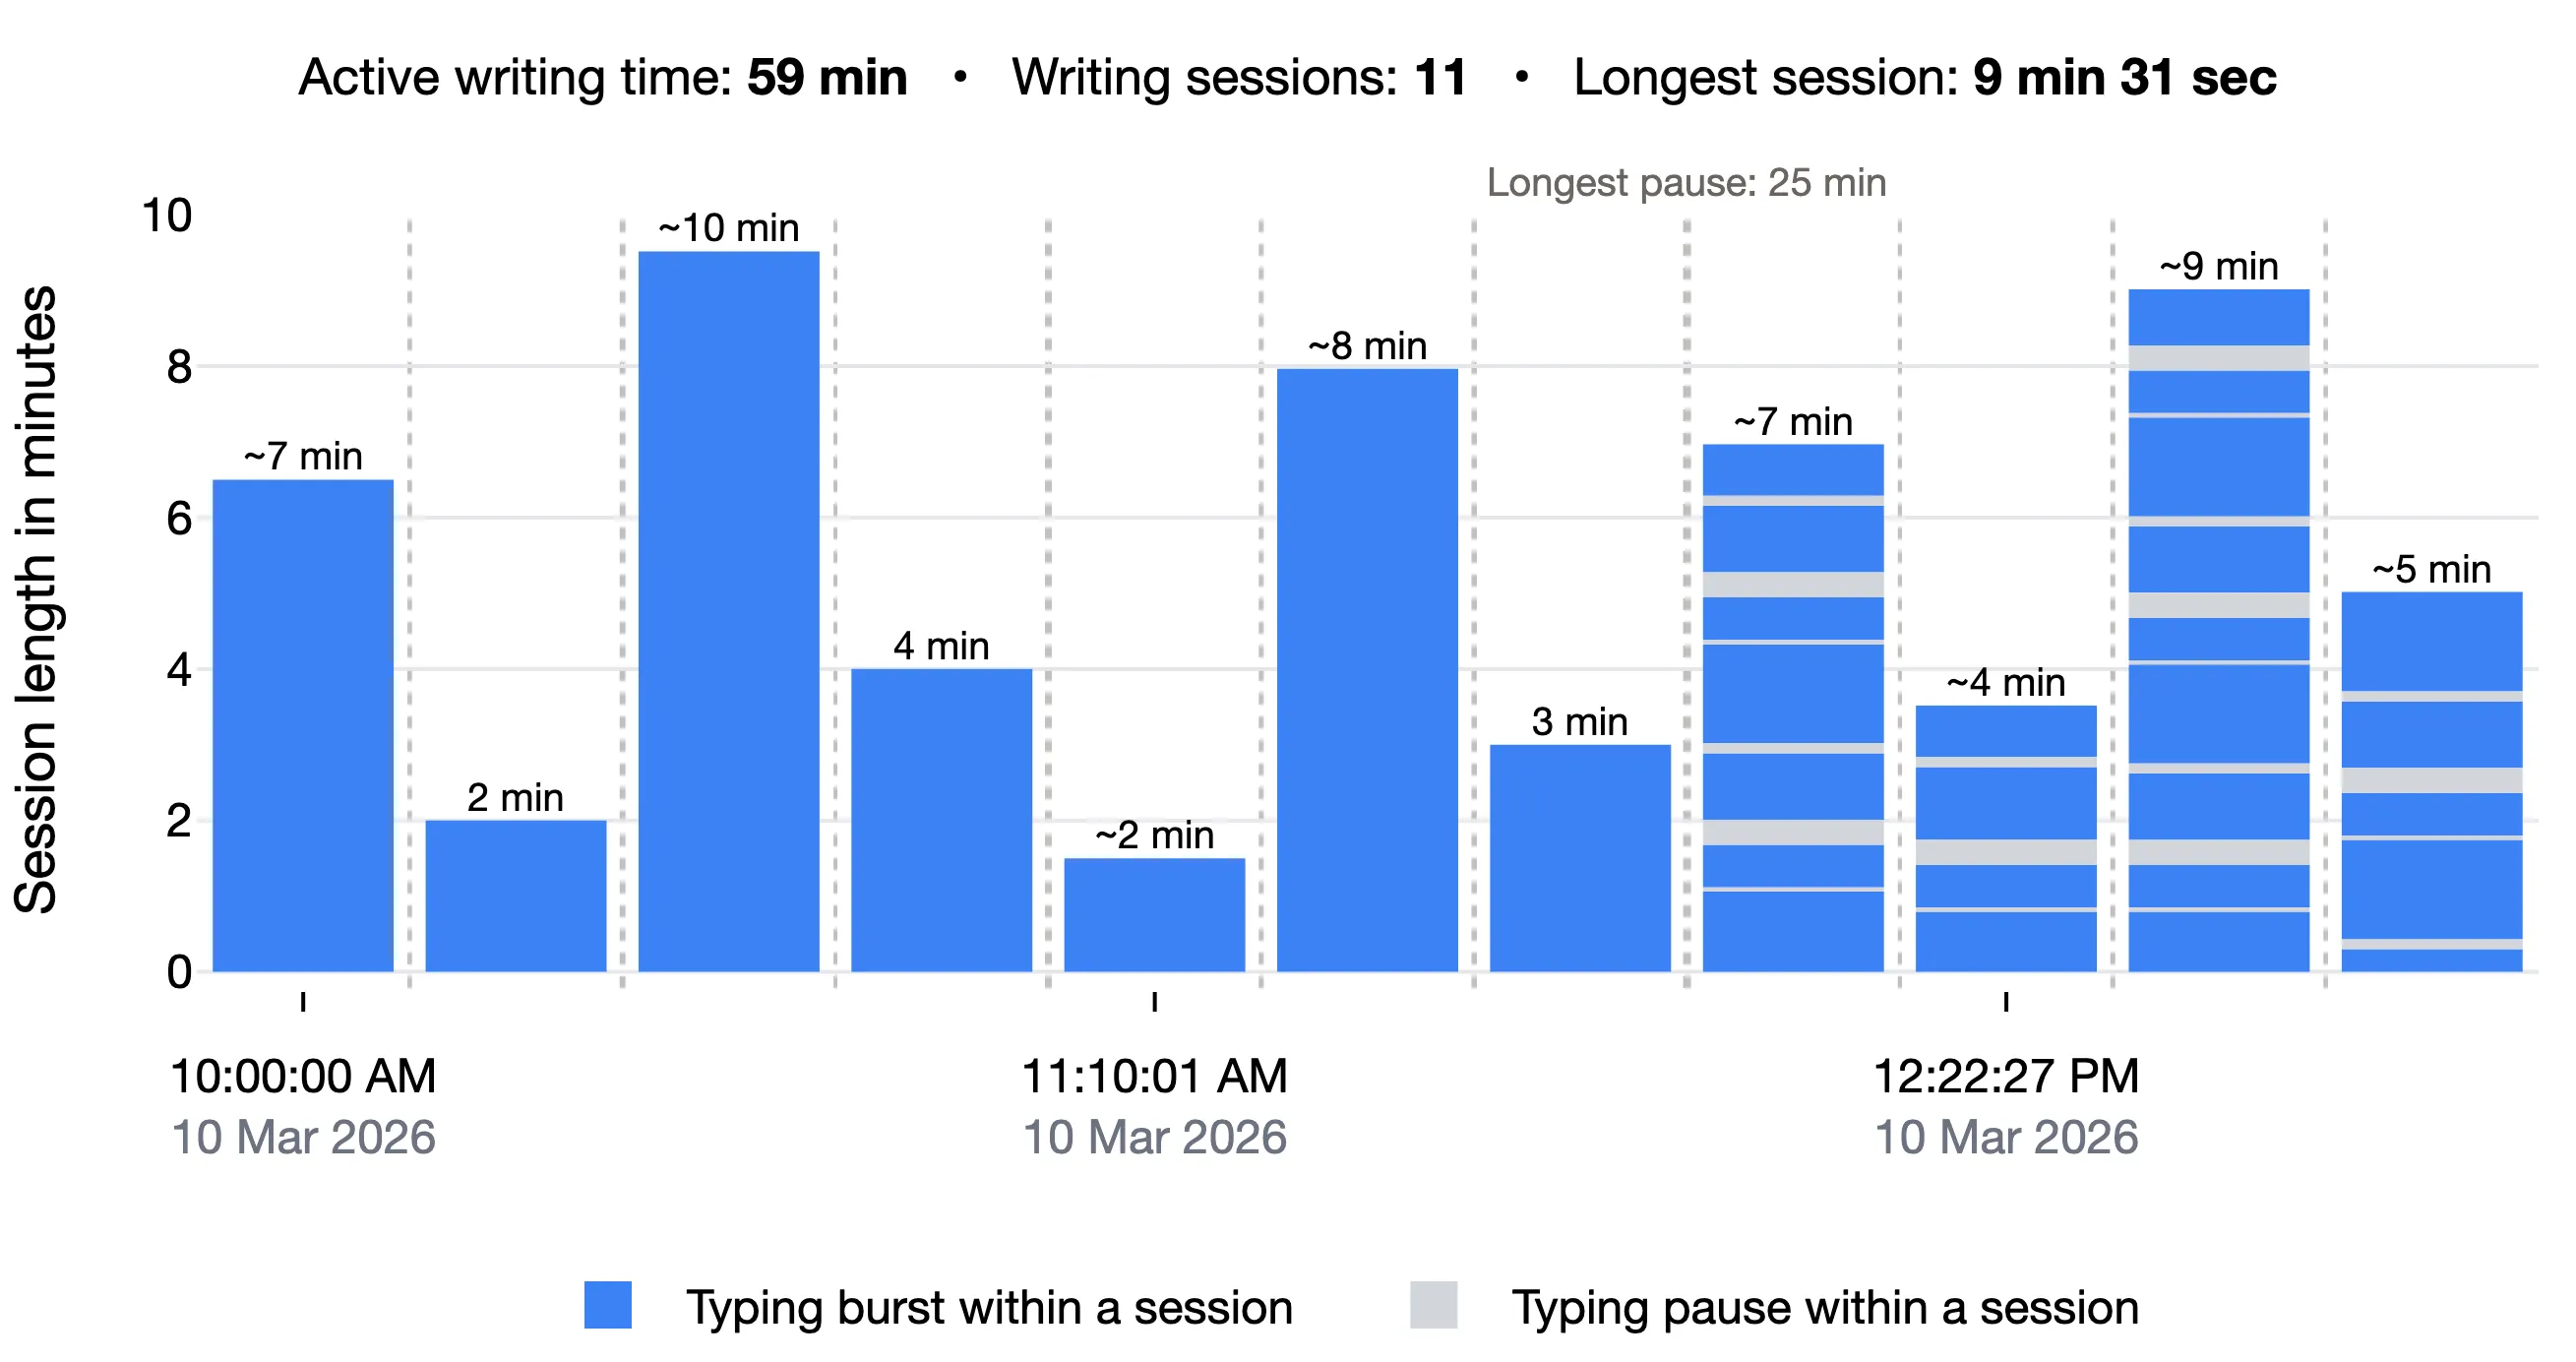
The first seven sessions are solid blue: steady writing with no stops at all. After the longest pause, 25 min, the last four sessions are striped with grey: bursty writing.
The same student wrote two different ways in one morning. One reading is that the first part was fast drafting, and the second part was slower revising, which means reading, deciding, and changing a little at a time. Another reading is that the first part was typed from a source, and the student started composing after the long pause. To tell the two apart, open a session in Compare Two Snapshots, or look at the same time in Writing Linearity.
4. Bursty writing over several days
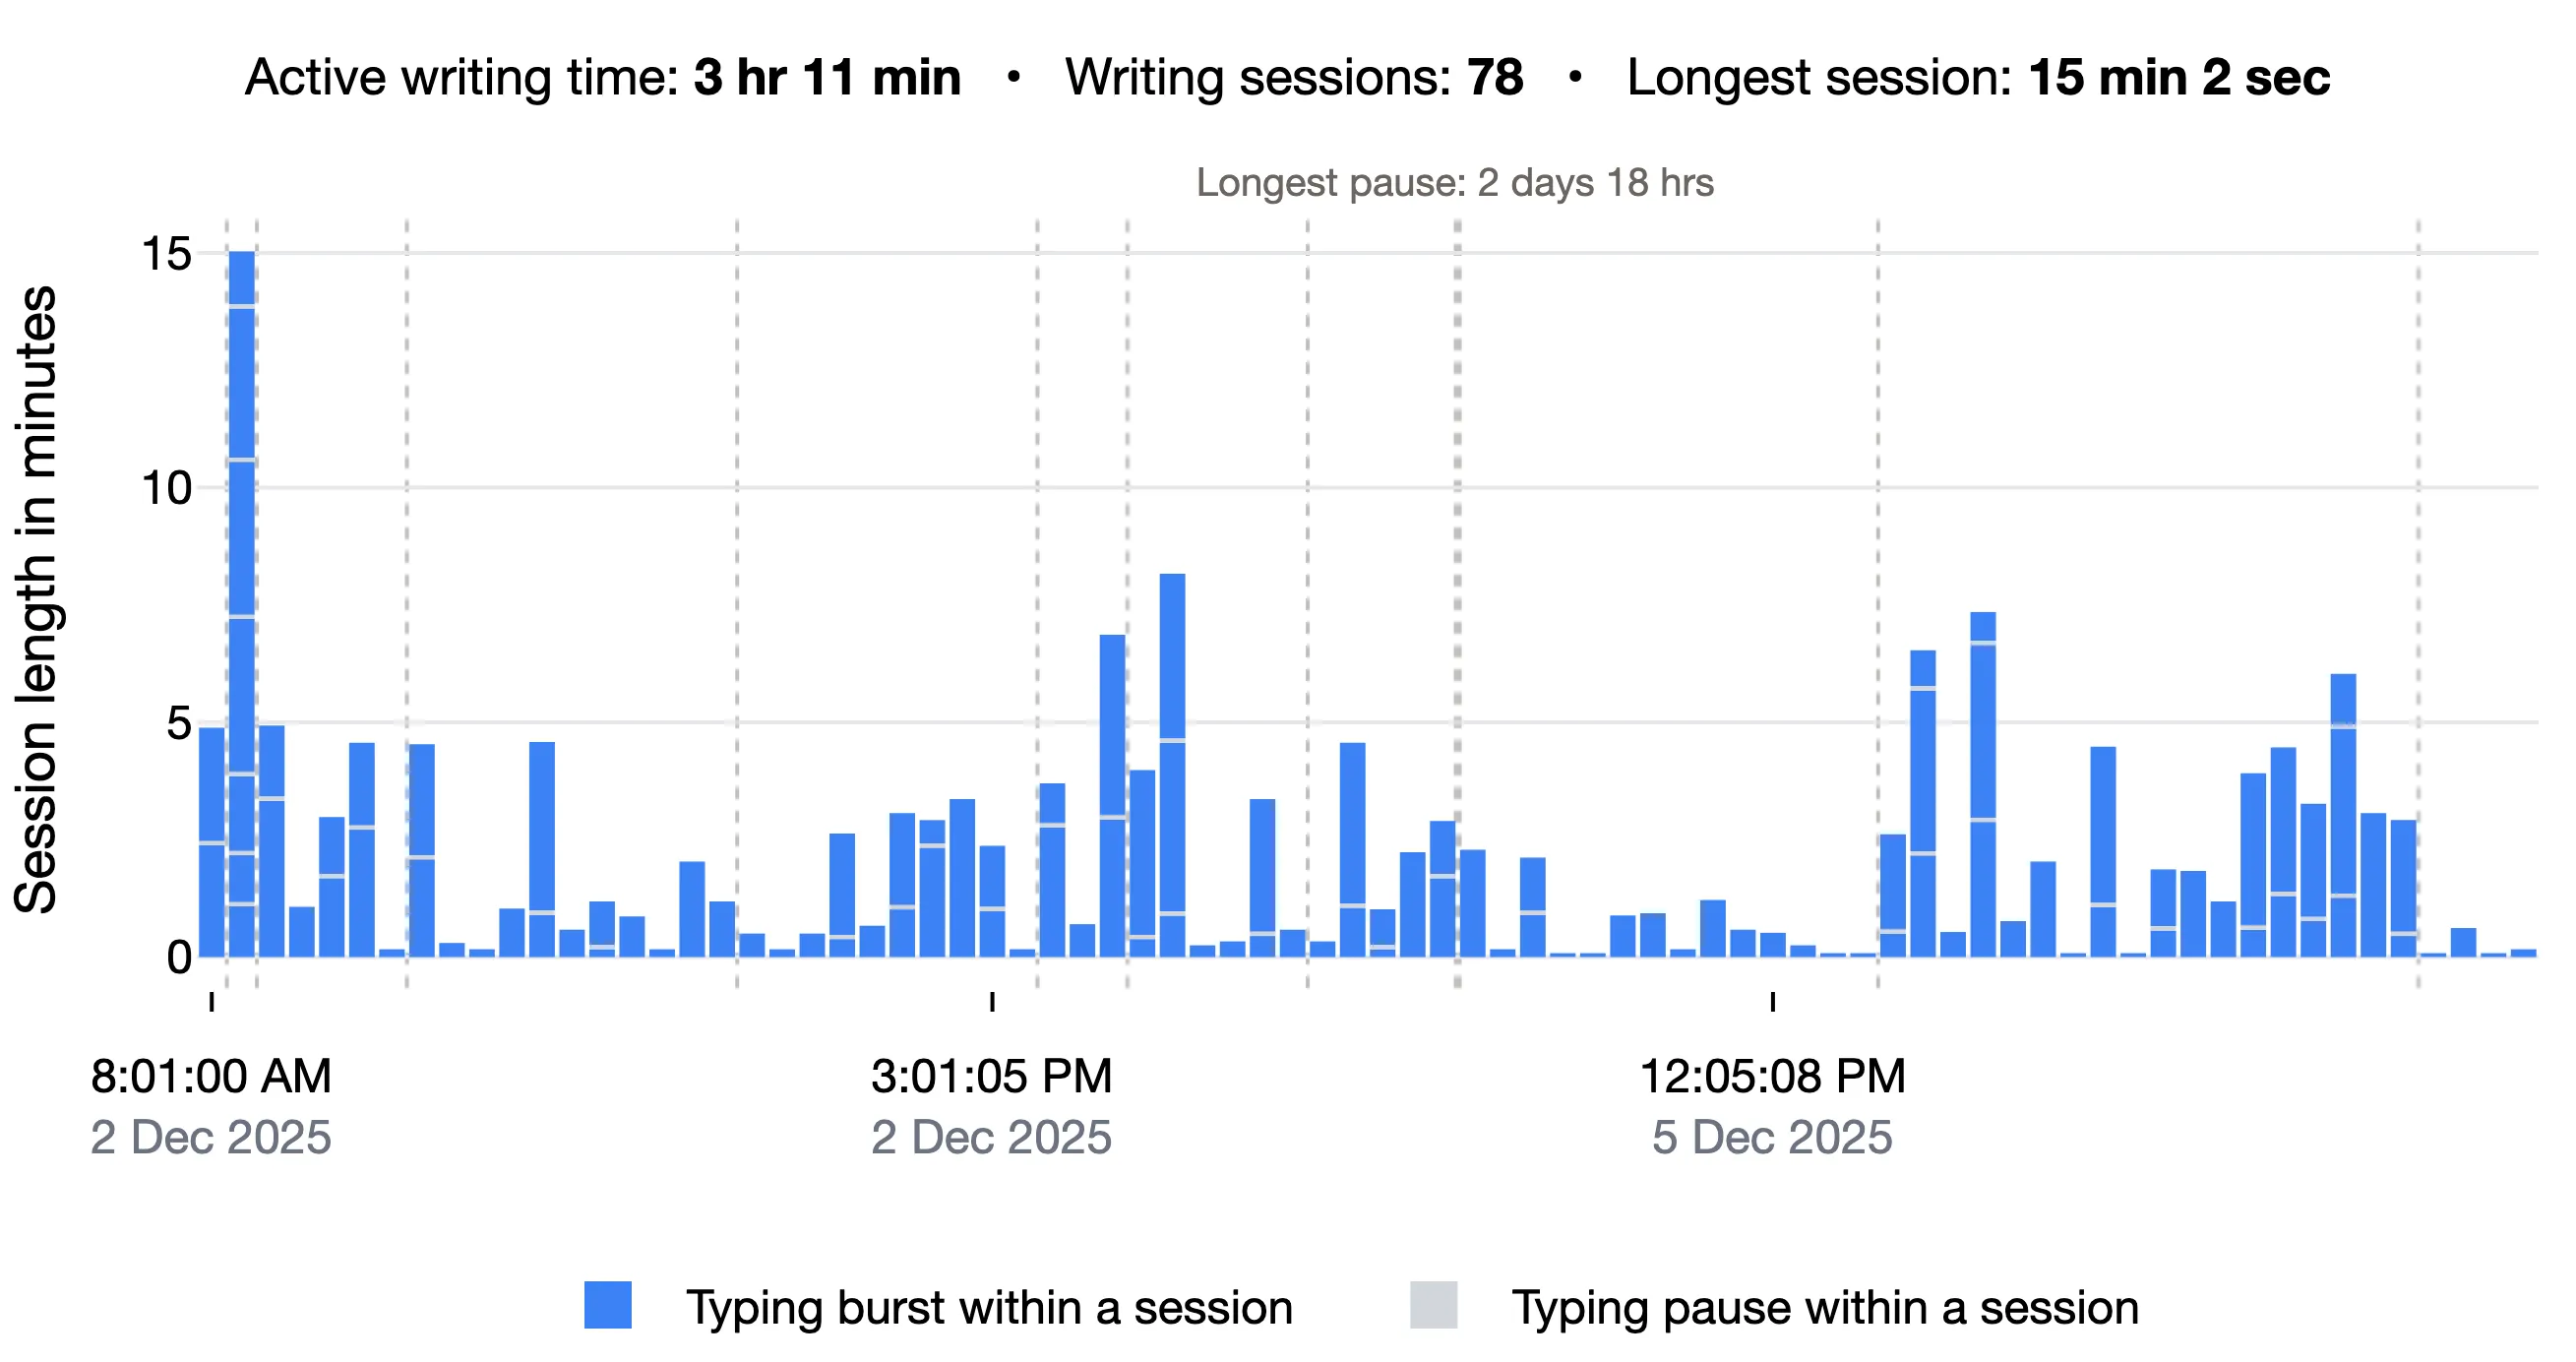
Seventy-eight sessions, starting on 2 Dec. After a pause of 2 days 18 hrs, the writing picks up again on 5 Dec. Sessions range from a few seconds to 15 minutes. The very short ones are usually quick visits, such as coming back to fix a word.
Look inside the bars. Most sessions longer than two minutes have one or more thin grey lines: short stops of a few seconds. The longest session, near the start, stops six times. The stops are fewer than in example 2, but they show up in almost every longer session. This is bursty writing, spread over a long document.
In a chart this busy, the grey lines are thin. Use the zoom buttons in the chart toolbar to see them clearly.
5. Steady writing over several days
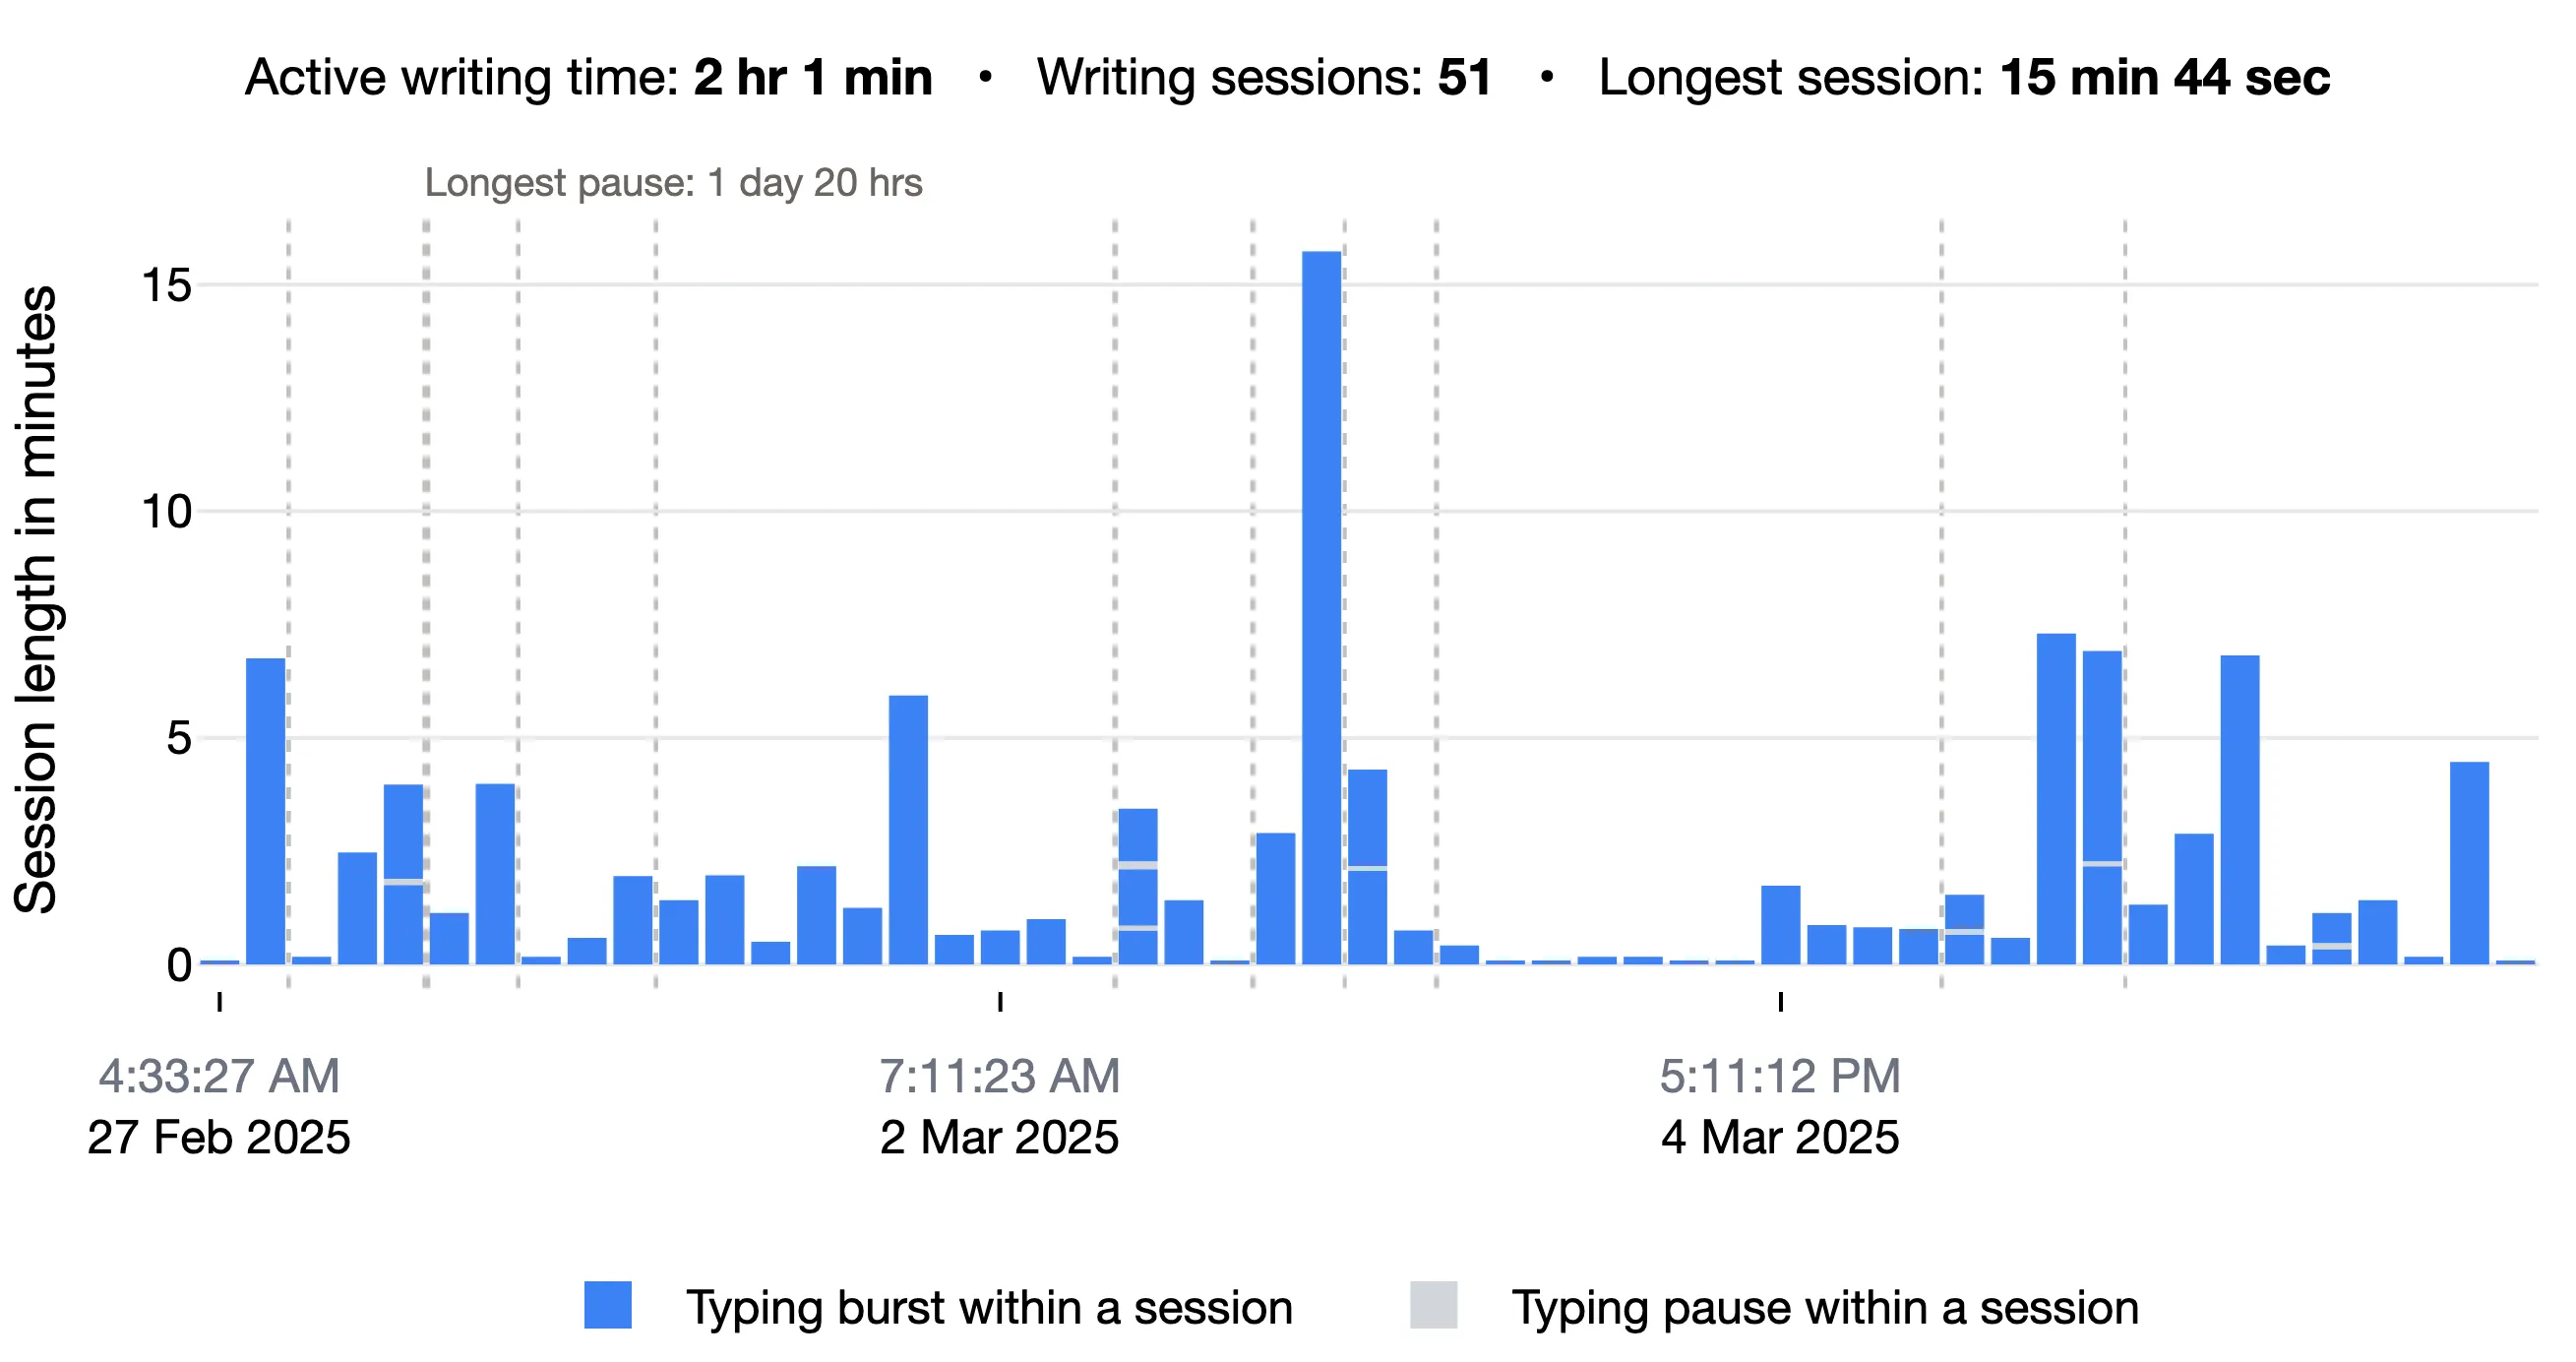
Fifty-one sessions over about a week, starting on 27 Feb. At first glance, this looks like example 4. The sessions range from a few seconds to about 15 minutes, and the summary numbers are similar: two to three hours of active writing, dozens of sessions, and a longest session of about 15 minutes. On the surface, this is a good process. The work is spread over many days, a little at a time.
Look inside the bars, and the two examples are very different. Almost every bar is solid blue. Only a few sessions have a short stop. The longest session, nearly 16 minutes, has none at all. This is steady writing, like example 1, kept up for a week.
Composing a long document usually means stopping to think, as in example 4. Typing steadily, session after session, can mean the student was typing from a plan or a draft they had already written somewhere else. It can also mean they were retyping text from another source, such as an AI tool, a little at a time. Spreading the work over many days does not change how each session was typed.
The summary row does not show this difference. You can only see it inside the bars. Before drawing a conclusion, check Writing Pace, and open a long session in Compare Two Snapshots to see what was written in it.
H. Video tutorial
Coming soon.
I. Using it in class
Students often recognize their own rhythm in this chart, which makes it useful for reflection:
- What were you working on in your longest session?
- What happened during your longest pause? Often this is where the thinking happened. It helps to say this out loud to a student who thinks only typing counts as work.
- Do you write better in short sessions or long ones? The chart gives them evidence to answer with.